Weekly Ichimoku Review of S&P 500 Index
I had a lot of fun calling directions the last few weeks.
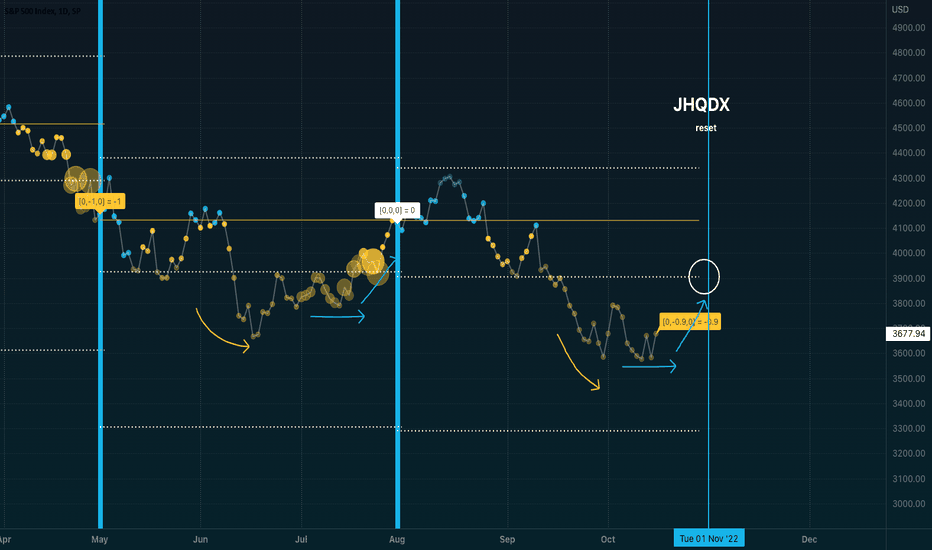
Best Long Call - 2 week bear rally.
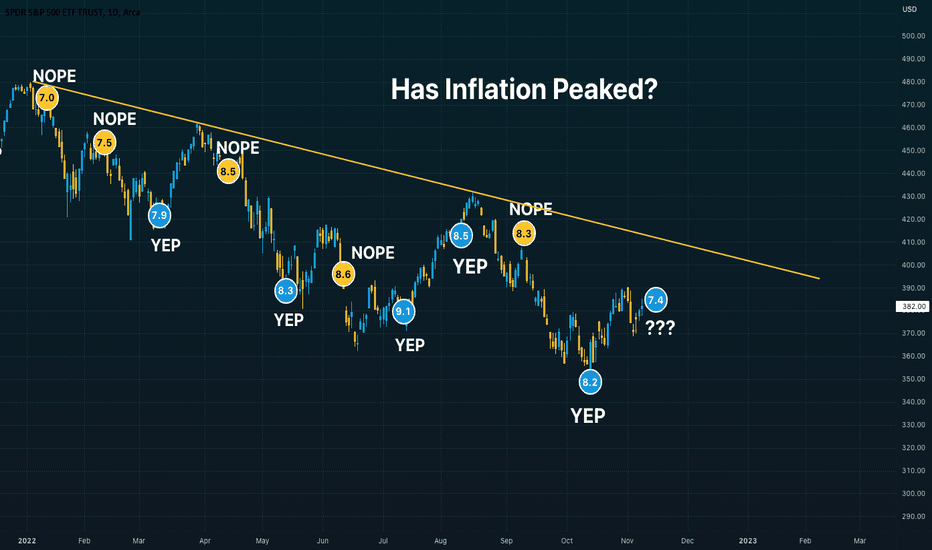
Most Profitable - Oct Inflation Print
Epic Daily Call - Paramount Double Bottom

Some serious Alpha takes being able to spot trends.
My indicator of choice for trend spotting is Ichimoku Cloud.
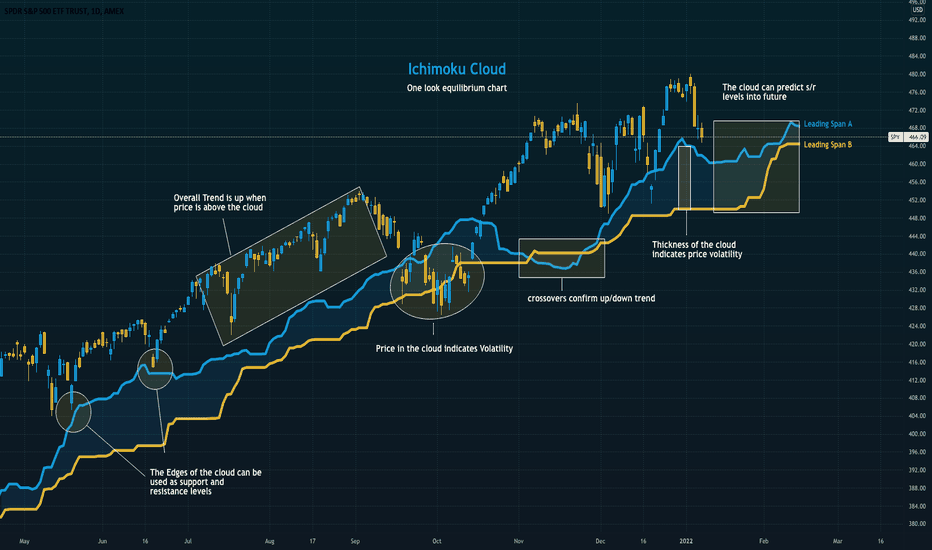
Ichimoku Cloud
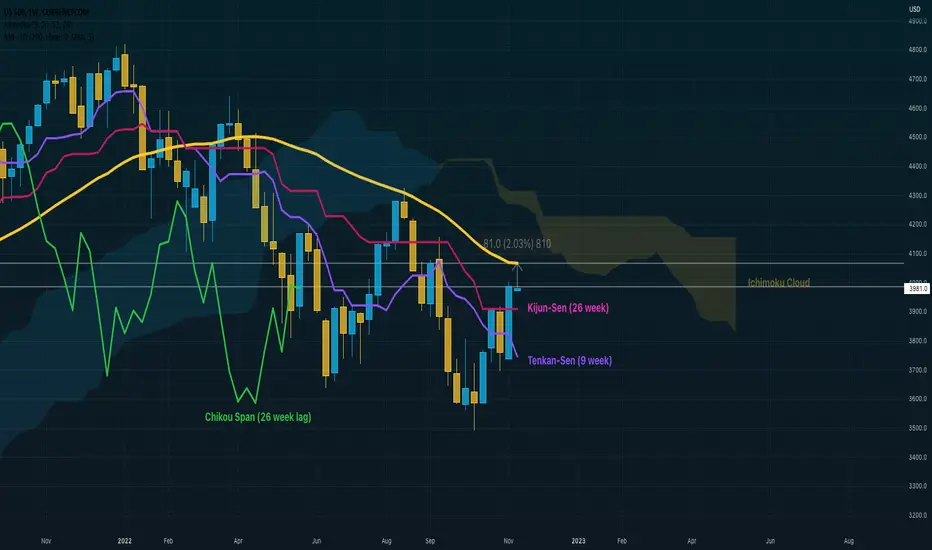
C1 - Bullish
3 weeks to least resistance cross over of bearish trend (price moving over cloud).
C2 - Bearish
Thick weekly cloud indicating a ways to go before cloud crosses over bullish.
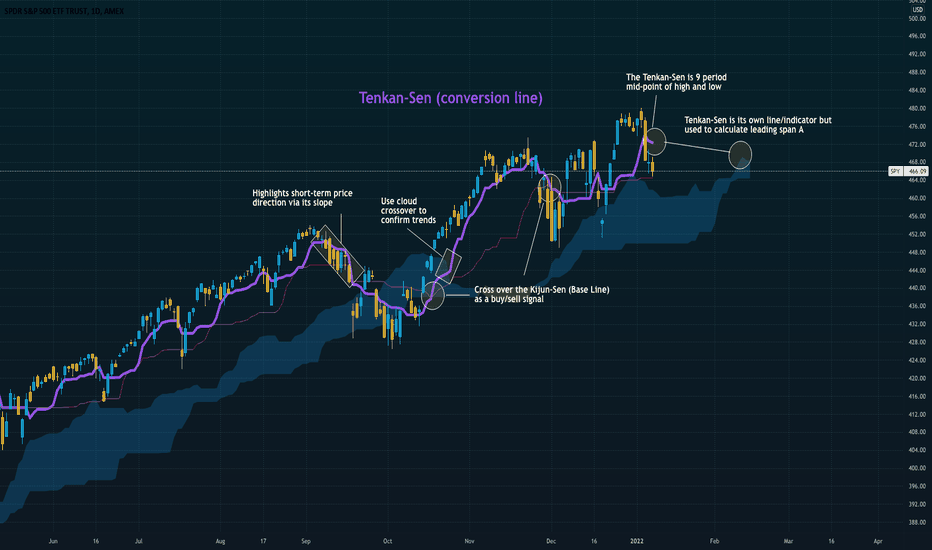
Tenkan-Sen (conversion)
TS1 - Bearish
9 week trend (short term) is still trending down.
TS2 - Bullish
Weekly high broke to over the 9 week trend.
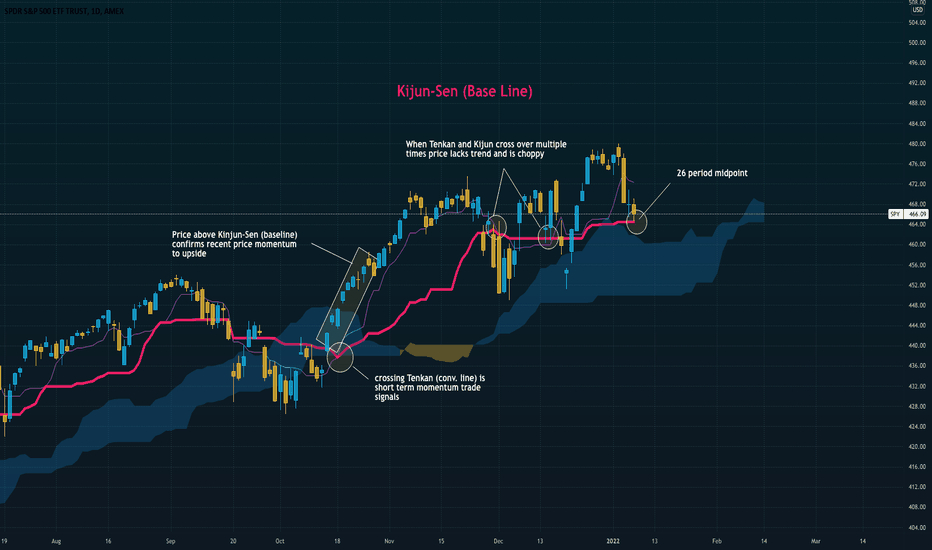
Kijun-Sen (Baseline)
KS1- Bullish
Price broke above 26 week trend line after previous 2 failed week failed attempts (3909.2).
KS2- Bearish
26 week is above 9 week
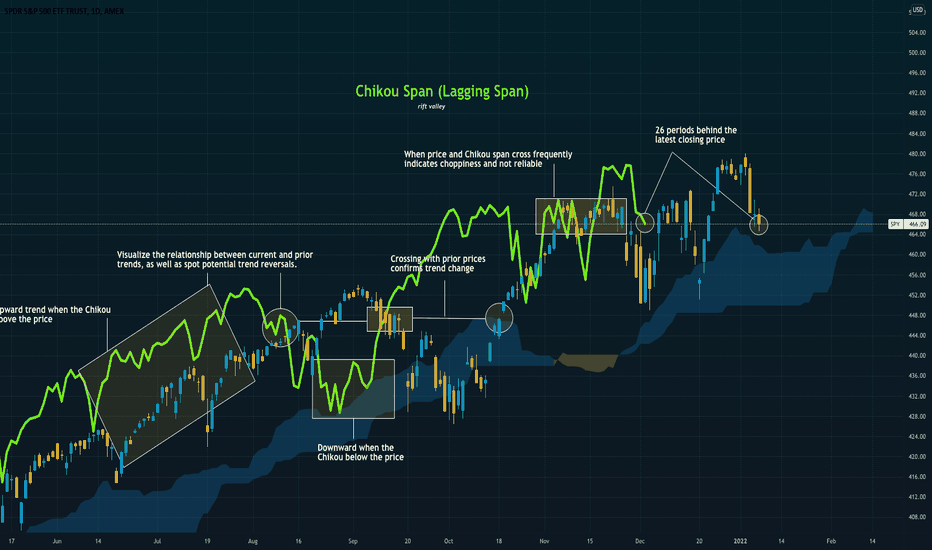
Chikou Span (Lagging Span)
CS1 - Bullish
Cross over the 26 week lagging trend line.
CS2 - Bearish
2-3 weeks of choppiness in store.
My overall analysis for the upcoming week is slightly Bullish.
My personal trading target for the week is positive by 2-3% with a test of the 200 day moving average to confirm Short term bull trend.
The last time an attempt was made to break 200D was the bull trend peak in august.
My biggest concern right now is the window of weakness going into thanksgiving weekend.

I will be doing more analysis on the Window of Weakness in the next few weeks prior to thanksgiving.
PPI is Tuesday so keep an eye on that for a short term bump or down.
If PPI does not decrease by a significant amount as CPI, look to give back some of last weeks gains.
Bulls need to hold 3900.
Bears need to position for test of 200D this week and should be mindful of OPEX.
OPEX is this week for which 4000 seems to be a magnet.
Best Long Call - 2 week bear rally.
Most Profitable - Oct Inflation Print
Epic Daily Call - Paramount Double Bottom
Some serious Alpha takes being able to spot trends.
My indicator of choice for trend spotting is Ichimoku Cloud.
Ichimoku Cloud
C1 - Bullish
3 weeks to least resistance cross over of bearish trend (price moving over cloud).
C2 - Bearish
Thick weekly cloud indicating a ways to go before cloud crosses over bullish.
Tenkan-Sen (conversion)
TS1 - Bearish
9 week trend (short term) is still trending down.
TS2 - Bullish
Weekly high broke to over the 9 week trend.
Kijun-Sen (Baseline)
KS1- Bullish
Price broke above 26 week trend line after previous 2 failed week failed attempts (3909.2).
KS2- Bearish
26 week is above 9 week
Chikou Span (Lagging Span)
CS1 - Bullish
Cross over the 26 week lagging trend line.
CS2 - Bearish
2-3 weeks of choppiness in store.
My overall analysis for the upcoming week is slightly Bullish.
My personal trading target for the week is positive by 2-3% with a test of the 200 day moving average to confirm Short term bull trend.
The last time an attempt was made to break 200D was the bull trend peak in august.
My biggest concern right now is the window of weakness going into thanksgiving weekend.
I will be doing more analysis on the Window of Weakness in the next few weeks prior to thanksgiving.
PPI is Tuesday so keep an eye on that for a short term bump or down.
If PPI does not decrease by a significant amount as CPI, look to give back some of last weeks gains.
Bulls need to hold 3900.
Bears need to position for test of 200D this week and should be mindful of OPEX.
OPEX is this week for which 4000 seems to be a magnet.

관련 발행물
면책사항
해당 정보와 게시물은 금융, 투자, 트레이딩 또는 기타 유형의 조언이나 권장 사항으로 간주되지 않으며, 트레이딩뷰에서 제공하거나 보증하는 것이 아닙니다. 자세한 내용은 이용 약관을 참조하세요.
관련 발행물
면책사항
해당 정보와 게시물은 금융, 투자, 트레이딩 또는 기타 유형의 조언이나 권장 사항으로 간주되지 않으며, 트레이딩뷰에서 제공하거나 보증하는 것이 아닙니다. 자세한 내용은 이용 약관을 참조하세요.