
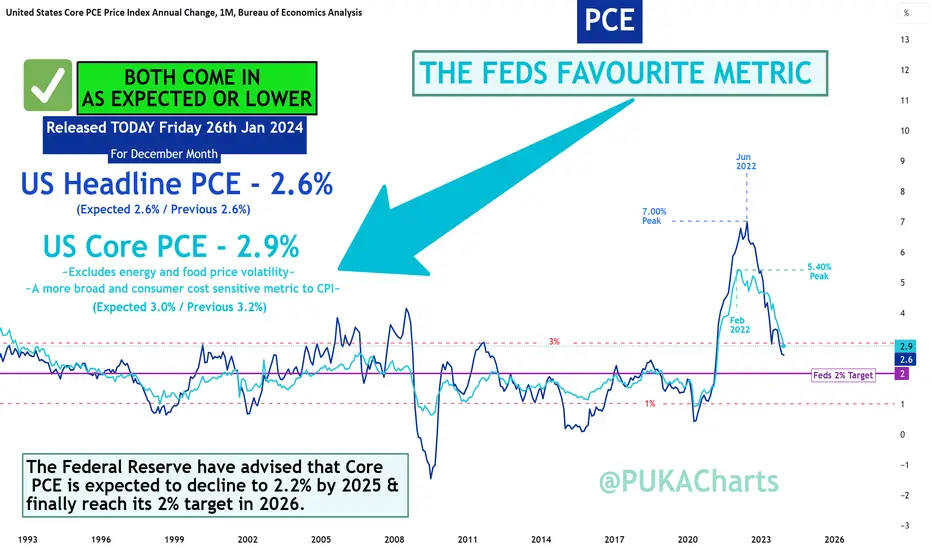
U.S Core PCE (FEDS FAVOURITE METRIC)
Rep: 2.9% ✅ Lower Than Expected ✅
Exp: 3.0%
Prev: 3.2%
U.S. Headline PCE
Rep: 2.6% ✅ In Line with Expectations ✅
Exp: 2.6%
Prev: 2.6%
Historical Core PCE Norms
On the chart you can see that since 1990 the typical Core PCE range is between 1 - 3% (red dotted lines on chart). We are slowly getting back down into this more historically moderate level. We have just fallen below the 3% level and down into the historically moderate zone for PCE levels.
The Federal Reserve have advised that Core PCE is expected to decline to 2.2% by 2025 & finally reach its 2% target in 2026. At this rate we might reach 2% a little sooner than that.
For the full breakdown of the Core and Headline PCE and to know the differences between PCE and CPI, please review the Macro Monday I previously released which explains it all (in the comments below).
PUKA
Rep: 2.9% ✅ Lower Than Expected ✅
Exp: 3.0%
Prev: 3.2%
U.S. Headline PCE
Rep: 2.6% ✅ In Line with Expectations ✅
Exp: 2.6%
Prev: 2.6%
Historical Core PCE Norms
On the chart you can see that since 1990 the typical Core PCE range is between 1 - 3% (red dotted lines on chart). We are slowly getting back down into this more historically moderate level. We have just fallen below the 3% level and down into the historically moderate zone for PCE levels.
The Federal Reserve have advised that Core PCE is expected to decline to 2.2% by 2025 & finally reach its 2% target in 2026. At this rate we might reach 2% a little sooner than that.
For the full breakdown of the Core and Headline PCE and to know the differences between PCE and CPI, please review the Macro Monday I previously released which explains it all (in the comments below).
PUKA

관련 발행물
면책사항
해당 정보와 게시물은 금융, 투자, 트레이딩 또는 기타 유형의 조언이나 권장 사항으로 간주되지 않으며, 트레이딩뷰에서 제공하거나 보증하는 것이 아닙니다. 자세한 내용은 이용 약관을 참조하세요.
관련 발행물
면책사항
해당 정보와 게시물은 금융, 투자, 트레이딩 또는 기타 유형의 조언이나 권장 사항으로 간주되지 않으며, 트레이딩뷰에서 제공하거나 보증하는 것이 아닙니다. 자세한 내용은 이용 약관을 참조하세요.