

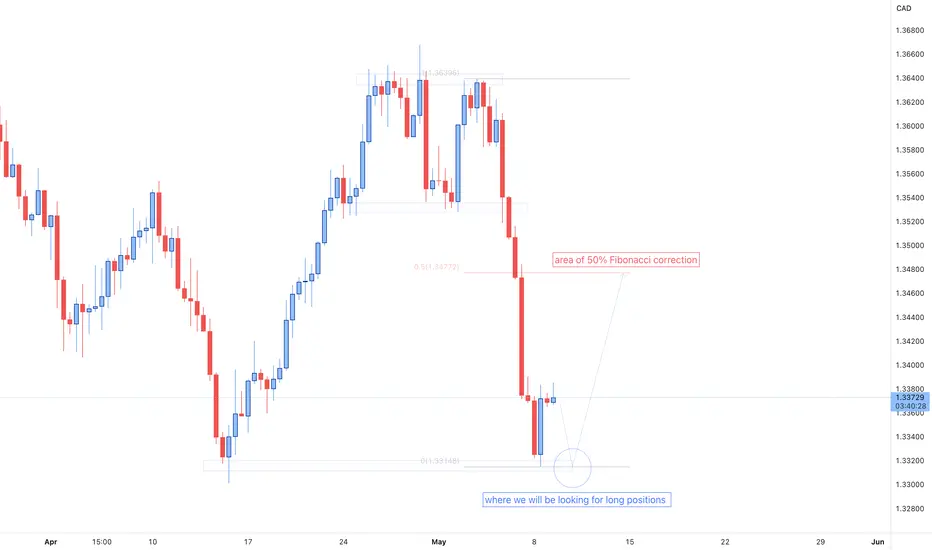
As it can be inferred from the H8-timeframe graph, the price has made a successful initial bounce off the 1.331 - 1.332 area of support that is highlighted on the graph.
Observing the ongoing price development, is can be noticed that the price is failing to push higher, and that it might perform another re-touch of the same zone (1.331 - 1.332) and form another bottom (a Double Bottom formation) before commencing its bullish moves.
Hence, we are having close eyes on the region circled on the graphic (1.33 - 1.332) and awaiting the price to reach that specific level before continuing the upside run.
Our initial target will be set at the area of 50% Fibonacci retracement level drawn from the top to the bottom of the recent bearish impulse.
Observing the ongoing price development, is can be noticed that the price is failing to push higher, and that it might perform another re-touch of the same zone (1.331 - 1.332) and form another bottom (a Double Bottom formation) before commencing its bullish moves.
Hence, we are having close eyes on the region circled on the graphic (1.33 - 1.332) and awaiting the price to reach that specific level before continuing the upside run.
Our initial target will be set at the area of 50% Fibonacci retracement level drawn from the top to the bottom of the recent bearish impulse.

면책사항
해당 정보와 게시물은 금융, 투자, 트레이딩 또는 기타 유형의 조언이나 권장 사항으로 간주되지 않으며, 트레이딩뷰에서 제공하거나 보증하는 것이 아닙니다. 자세한 내용은 이용 약관을 참조하세요.
면책사항
해당 정보와 게시물은 금융, 투자, 트레이딩 또는 기타 유형의 조언이나 권장 사항으로 간주되지 않으며, 트레이딩뷰에서 제공하거나 보증하는 것이 아닙니다. 자세한 내용은 이용 약관을 참조하세요.