

Hi, new trader here. I'm trading on a naked chart
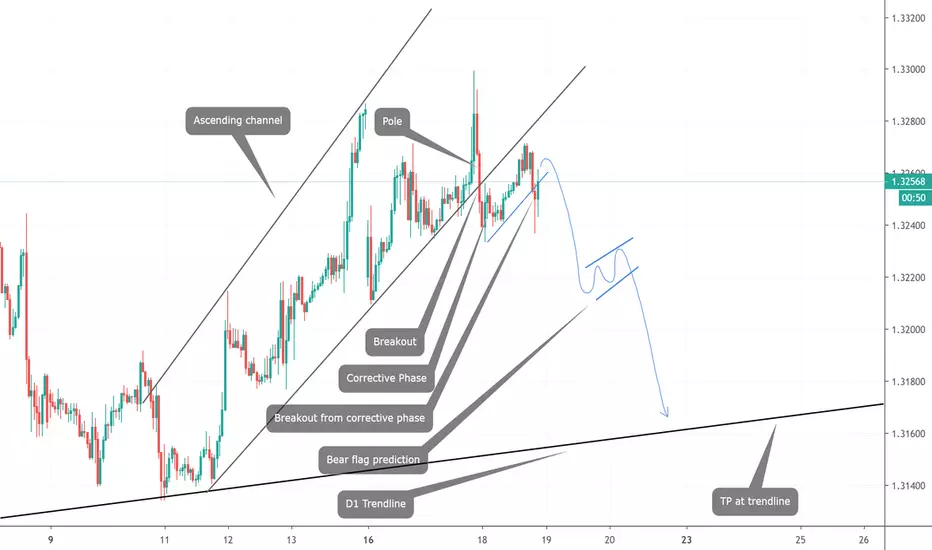
I've analysed USDCAD heading for a downtrend. It has broken off the ascending channel and formed a corrective phase.
From the figure above, it has broken off the corrective phase and could potentially go for a downtrend.
I've set a potential TP point when it touches the trendline on the higher timeframe.
Any comments and opinions please comment below. Thank you :)

면책사항
해당 정보와 게시물은 금융, 투자, 트레이딩 또는 기타 유형의 조언이나 권장 사항으로 간주되지 않으며, 트레이딩뷰에서 제공하거나 보증하는 것이 아닙니다. 자세한 내용은 이용 약관을 참조하세요.
면책사항
해당 정보와 게시물은 금융, 투자, 트레이딩 또는 기타 유형의 조언이나 권장 사항으로 간주되지 않으며, 트레이딩뷰에서 제공하거나 보증하는 것이 아닙니다. 자세한 내용은 이용 약관을 참조하세요.