

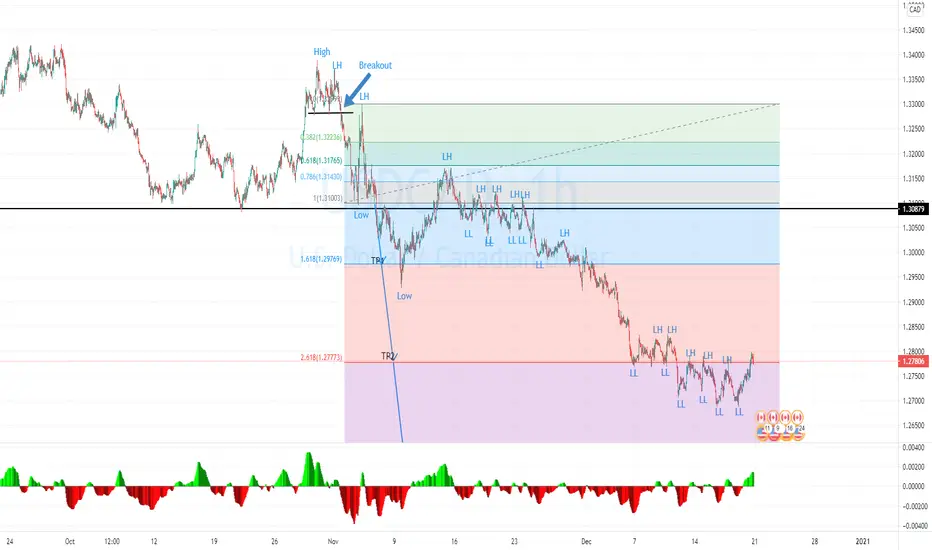
USDCAD on the 1H time-frame.
Steps:
1. The price still running downtrend by created the lower high and lower low.
2. The price already hit TP1: 1.29769 and TP2: 1.27773 at the Fibonacci level.
3. The next level is TP3: 1.25431 and 1.24546 at the support zone in Day time frame.
4. If the next MACD (-) create the higher low then there will be the 1st step of the reversal pattern.
Steps:
1. The price still running downtrend by created the lower high and lower low.
2. The price already hit TP1: 1.29769 and TP2: 1.27773 at the Fibonacci level.
3. The next level is TP3: 1.25431 and 1.24546 at the support zone in Day time frame.
4. If the next MACD (-) create the higher low then there will be the 1st step of the reversal pattern.

면책사항
해당 정보와 게시물은 금융, 투자, 트레이딩 또는 기타 유형의 조언이나 권장 사항으로 간주되지 않으며, 트레이딩뷰에서 제공하거나 보증하는 것이 아닙니다. 자세한 내용은 이용 약관을 참조하세요.
면책사항
해당 정보와 게시물은 금융, 투자, 트레이딩 또는 기타 유형의 조언이나 권장 사항으로 간주되지 않으며, 트레이딩뷰에서 제공하거나 보증하는 것이 아닙니다. 자세한 내용은 이용 약관을 참조하세요.