

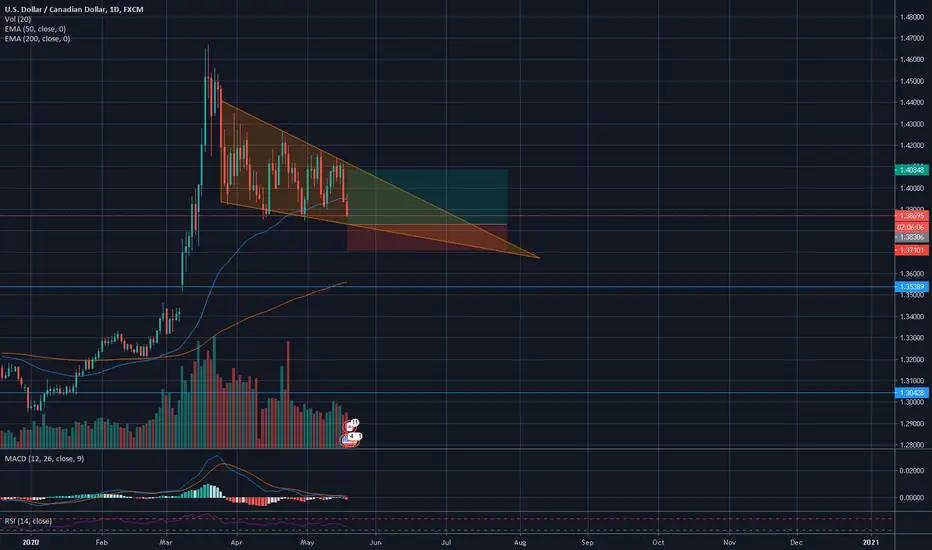
This trade looks very promising. The market is currently moving in a descending triangle as shown. This means lower lows and lower highs. We are currently approaching the low of the edge of the triangle. Secondly, the 50 Period EMA has been dis-respected therefore we expect it to bounce back from it. Thirdly, the market is moving above the 200 EMA supporting the trend that the market is moving in the uptrend. We are currently looking for an entry point to go long which could include a MACD signal overlap (which is looking very probable and soon) and some sort of bullish candlestick pattern.
노트
Make sure to place your stop loss at some higher edge of the triangle노트
There is a possible chance of a market breakout due to the consolidation taking in the descending triangle so be careful and manage your risk with a stop loss.노트
However, I would expect if there were a breakout for it to be on the bullish side as that's the trend the 200 EMA is showing us노트
Looking at the lower time frame we can already see strong price rejection represented by the longer lower wicks of the candles represented by the recent candlesticks노트
Time to enter this trade I would say is now
면책사항
해당 정보와 게시물은 금융, 투자, 트레이딩 또는 기타 유형의 조언이나 권장 사항으로 간주되지 않으며, 트레이딩뷰에서 제공하거나 보증하는 것이 아닙니다. 자세한 내용은 이용 약관을 참조하세요.
면책사항
해당 정보와 게시물은 금융, 투자, 트레이딩 또는 기타 유형의 조언이나 권장 사항으로 간주되지 않으며, 트레이딩뷰에서 제공하거나 보증하는 것이 아닙니다. 자세한 내용은 이용 약관을 참조하세요.