

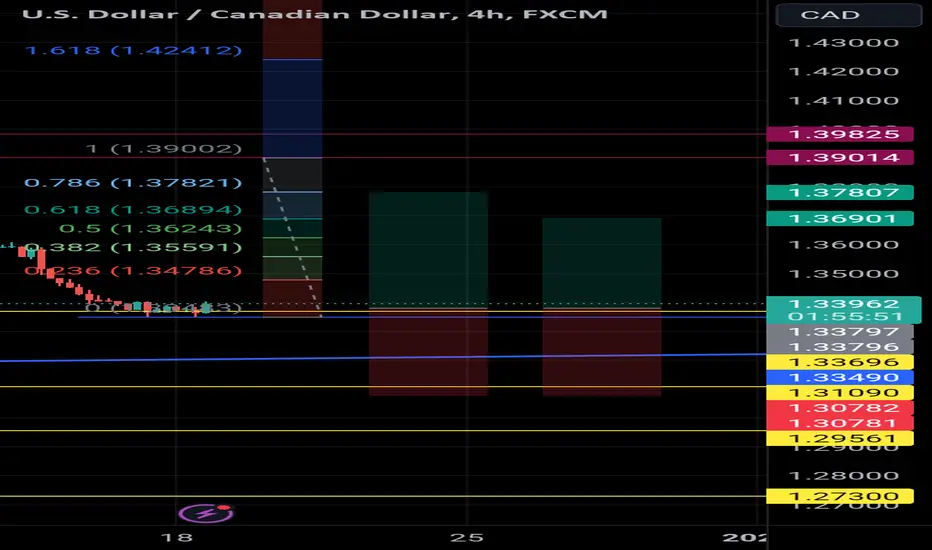
A #long trade opportunity recently presented itself on the #dollarloonie (#USDCAD) #trading chart 📈.
This is indicated by the #bullish harami candlestick 🕯️ pattern on the 1.33696 horizontal support level.
This indicates a fakeout of the same level, with potential price move in the upward 👆 ⬆️ direction (#buy).
Sufficient upward momentum should see price rallying towards the 1.38000 psychological level and possibly testing the strength of the 1.39014 horizontal resistance level.
As always, please apply appropriate risk management.
Happy trading!
#majorpair
This is indicated by the #bullish harami candlestick 🕯️ pattern on the 1.33696 horizontal support level.
This indicates a fakeout of the same level, with potential price move in the upward 👆 ⬆️ direction (#buy).
Sufficient upward momentum should see price rallying towards the 1.38000 psychological level and possibly testing the strength of the 1.39014 horizontal resistance level.
As always, please apply appropriate risk management.
Happy trading!
#majorpair

면책사항
해당 정보와 게시물은 금융, 투자, 트레이딩 또는 기타 유형의 조언이나 권장 사항으로 간주되지 않으며, 트레이딩뷰에서 제공하거나 보증하는 것이 아닙니다. 자세한 내용은 이용 약관을 참조하세요.
면책사항
해당 정보와 게시물은 금융, 투자, 트레이딩 또는 기타 유형의 조언이나 권장 사항으로 간주되지 않으며, 트레이딩뷰에서 제공하거나 보증하는 것이 아닙니다. 자세한 내용은 이용 약관을 참조하세요.