

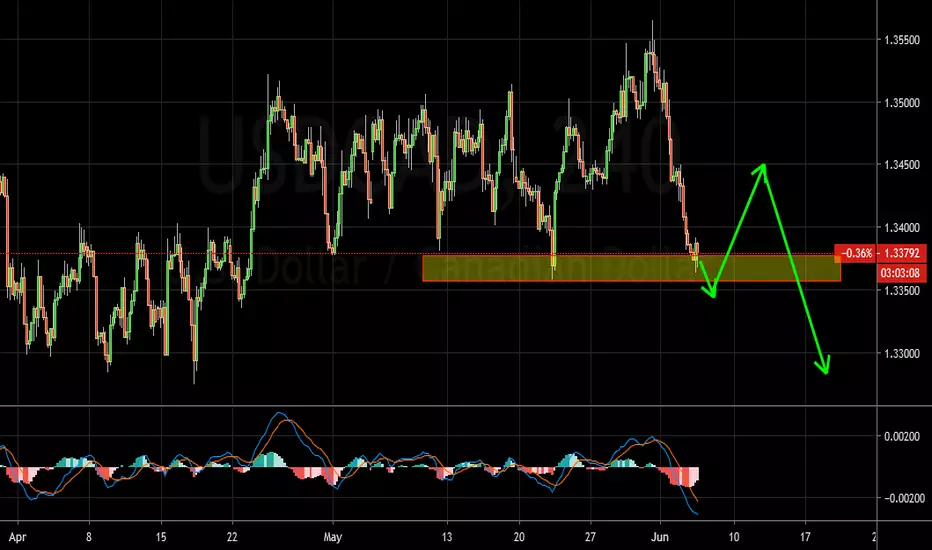
W1 - Price is still in the zone of a triple cycle ending up with resistance, we have a possible double top. We may now look for a correction in the form of two waves or a range.
As long as the last top holds, we may look for a retrace to happen towards the 50% retrace zone.
D1 - Second false break with divergence. Band to band movement.
H4 - Triple cycle, the price broke below the trend line and then it started to create lower lows. Currently we have Bollinger band duplication area.
By ideal we should see the price cleaning the area shown in the chart, We may then look for corrections and possible sells with more bearish evidences.
if we get a straight leg going through all the fibo retrace levels then it is a warning sign, so pay attention to this.
H1 - Price reached a critical zone, bullish divergence. We may now look for correction to happen in the form of double wave or range.
The bottom line here is, we may now look for retraces and sells with bearish evidences.
As long as the last top holds, we may look for a retrace to happen towards the 50% retrace zone.
D1 - Second false break with divergence. Band to band movement.
H4 - Triple cycle, the price broke below the trend line and then it started to create lower lows. Currently we have Bollinger band duplication area.
By ideal we should see the price cleaning the area shown in the chart, We may then look for corrections and possible sells with more bearish evidences.
if we get a straight leg going through all the fibo retrace levels then it is a warning sign, so pay attention to this.
H1 - Price reached a critical zone, bullish divergence. We may now look for correction to happen in the form of double wave or range.
The bottom line here is, we may now look for retraces and sells with bearish evidences.

면책사항
해당 정보와 게시물은 금융, 투자, 트레이딩 또는 기타 유형의 조언이나 권장 사항으로 간주되지 않으며, 트레이딩뷰에서 제공하거나 보증하는 것이 아닙니다. 자세한 내용은 이용 약관을 참조하세요.
면책사항
해당 정보와 게시물은 금융, 투자, 트레이딩 또는 기타 유형의 조언이나 권장 사항으로 간주되지 않으며, 트레이딩뷰에서 제공하거나 보증하는 것이 아닙니다. 자세한 내용은 이용 약관을 참조하세요.