

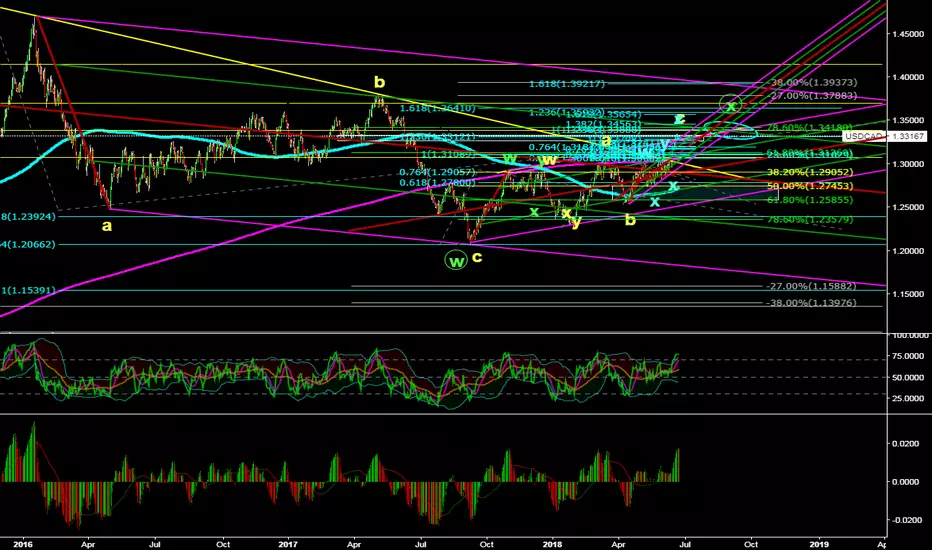
I know you can't see the chart, neither can I. But what I can tell you is that the 134.00 price level (basically the .786 from B-C high to low, is a key fibonacci level for many reasons, pitchforks, multiple trend fibs. I've looked at this pattern every way I can and it labels corrective every time. We may even get a nice sell from here, but that's a totally different discussion pattern wise. But basically, if Ucad hits 134.00, it should react down and there should be a long term sell to downside, at least to correct 50-62% of this upward pattern with the possibility of breaking the low. But I am talking about some long term stuff here. It looks like it is consolidating above trend line for a sell, but I am not completely convinced just yet.

면책사항
해당 정보와 게시물은 금융, 투자, 트레이딩 또는 기타 유형의 조언이나 권장 사항으로 간주되지 않으며, 트레이딩뷰에서 제공하거나 보증하는 것이 아닙니다. 자세한 내용은 이용 약관을 참조하세요.
면책사항
해당 정보와 게시물은 금융, 투자, 트레이딩 또는 기타 유형의 조언이나 권장 사항으로 간주되지 않으며, 트레이딩뷰에서 제공하거나 보증하는 것이 아닙니다. 자세한 내용은 이용 약관을 참조하세요.