

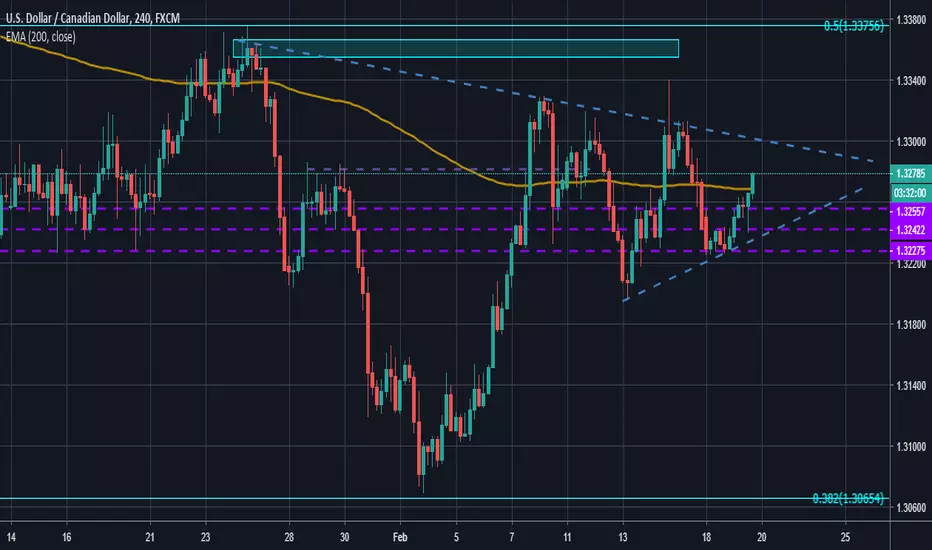
Price broke through the 200 day EMA and is moving towards the higher part of the wedge pattern we see forming. The way price is forming around the corner of the triangle reminds a bit of an inverse head and shoulders pattern.
For a bullish trade one should wait for a breakout of this pattern. In this case, the bullish movement would need to be strong and an entry around 1.3300 would be appropriate. You can also wait, see how strong the breakout is, and enter after the breakout and retest of the pattern. If price drops below 1.3200 or the 200EMA this trade would need to be closed as that could lead to a bearish decline. Especially if oil continues to climb.
For a bullish trade one should wait for a breakout of this pattern. In this case, the bullish movement would need to be strong and an entry around 1.3300 would be appropriate. You can also wait, see how strong the breakout is, and enter after the breakout and retest of the pattern. If price drops below 1.3200 or the 200EMA this trade would need to be closed as that could lead to a bearish decline. Especially if oil continues to climb.

면책사항
해당 정보와 게시물은 금융, 투자, 트레이딩 또는 기타 유형의 조언이나 권장 사항으로 간주되지 않으며, 트레이딩뷰에서 제공하거나 보증하는 것이 아닙니다. 자세한 내용은 이용 약관을 참조하세요.
면책사항
해당 정보와 게시물은 금융, 투자, 트레이딩 또는 기타 유형의 조언이나 권장 사항으로 간주되지 않으며, 트레이딩뷰에서 제공하거나 보증하는 것이 아닙니다. 자세한 내용은 이용 약관을 참조하세요.