

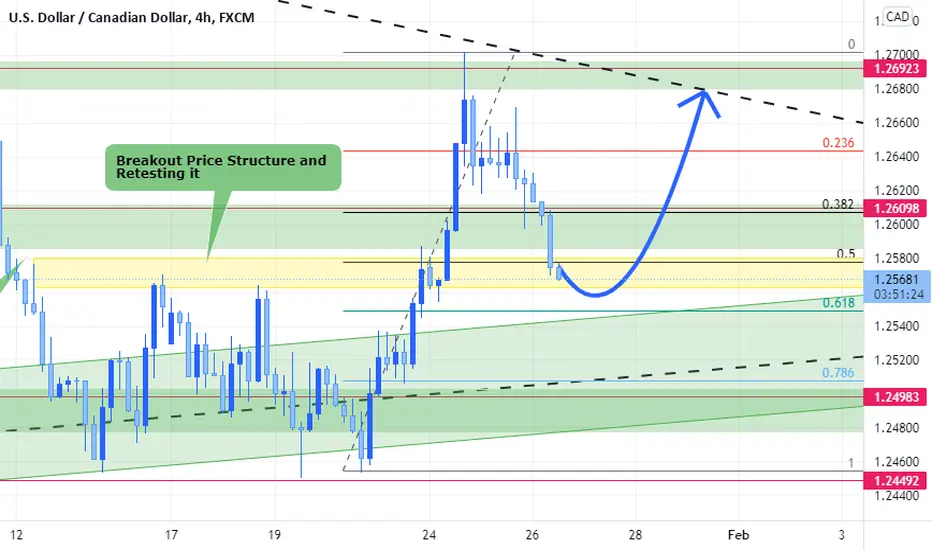
This pair is going bullish for now
Technical Analysis
1-Break out price structure and retesting it before continuation to the upside
2-Ascending Triangle Chart Pattern on weekly Time Frame
*Sentimental Analysis:
1-CADJPY Reached falling resistance level indicating bearish move for the pair (Indicating possible weakness for the CAD)

2-AUDCAD is making Q&M chart Pattern which is indication of bullish move for the pair(Indicating possible weakness for the CAD)

Technical Analysis
1-Break out price structure and retesting it before continuation to the upside
2-Ascending Triangle Chart Pattern on weekly Time Frame
*Sentimental Analysis:
1-CADJPY Reached falling resistance level indicating bearish move for the pair (Indicating possible weakness for the CAD)
2-AUDCAD is making Q&M chart Pattern which is indication of bullish move for the pair(Indicating possible weakness for the CAD)
거래청산: 타겟 닿음

면책사항
해당 정보와 게시물은 금융, 투자, 트레이딩 또는 기타 유형의 조언이나 권장 사항으로 간주되지 않으며, 트레이딩뷰에서 제공하거나 보증하는 것이 아닙니다. 자세한 내용은 이용 약관을 참조하세요.
면책사항
해당 정보와 게시물은 금융, 투자, 트레이딩 또는 기타 유형의 조언이나 권장 사항으로 간주되지 않으며, 트레이딩뷰에서 제공하거나 보증하는 것이 아닙니다. 자세한 내용은 이용 약관을 참조하세요.