

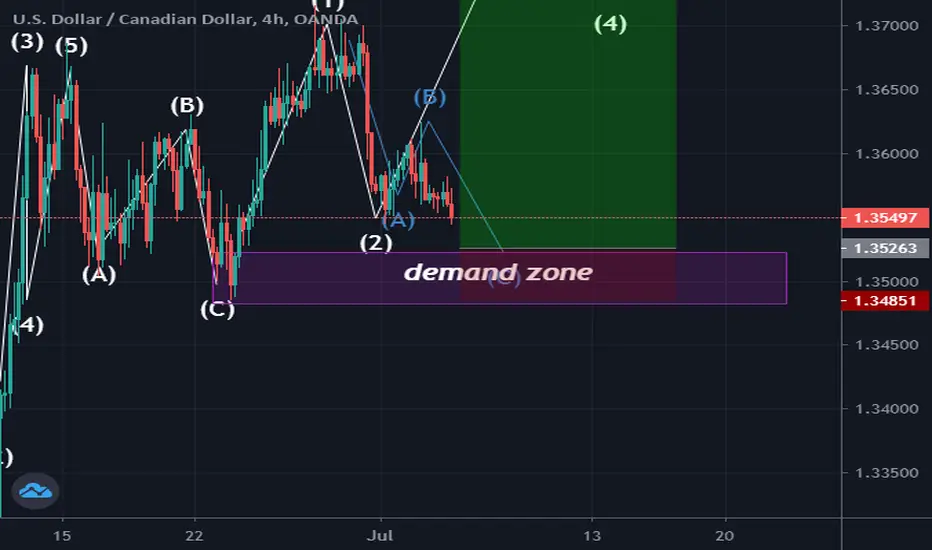
The USDCAD chart below is analyzed using both elliott wave and Demand and supply zone(the two most powerful technical analysis tools).The wave 2 of wave 3 extension is a potential zigzag in formation which on completion will end in the Demand zone(potential zone where buyers will come into the market massively) hence, a bullish rally is expected to end at the 1.618(no extension) or 2.618 (extension) fibonacci level as those are levels where wave 3 tends to end.The risk to reward ratio is compelling.......more pips guys....Kingofthemarket says hi

면책사항
해당 정보와 게시물은 금융, 투자, 트레이딩 또는 기타 유형의 조언이나 권장 사항으로 간주되지 않으며, 트레이딩뷰에서 제공하거나 보증하는 것이 아닙니다. 자세한 내용은 이용 약관을 참조하세요.
면책사항
해당 정보와 게시물은 금융, 투자, 트레이딩 또는 기타 유형의 조언이나 권장 사항으로 간주되지 않으며, 트레이딩뷰에서 제공하거나 보증하는 것이 아닙니다. 자세한 내용은 이용 약관을 참조하세요.