Hi everyone!
In the past few weeks we have already traded
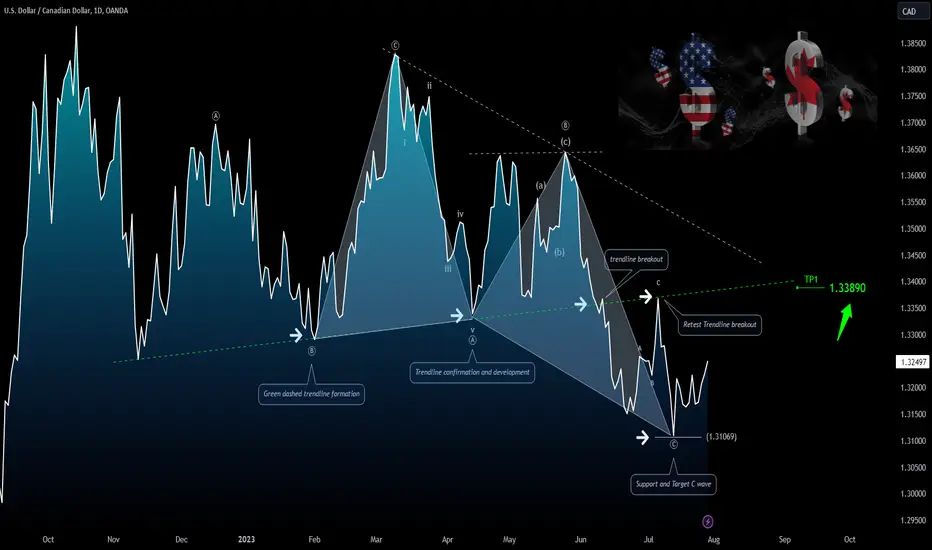
 USDCAD pair on the first trendline re-test, but at the same time this technical element could still be useful to us. The big picture on daily chart is harmonic structure followed by corrective structure with ABC Pattern formation.
✔ At the moment, we remain below an important resistance (not shown on chart), but if there is a bullish breakout during the first hours of trading, another bullish consolidation should appear, pushing the price to retest the trendline around the 1.3389 area.
✔ From a technical point of view and following the pair on intraday chart, it could be interesting to take a long position on pullback or corrective structure that will appear.
During the next hours/sessions, we will publish new updates, even on minor time frame in the section below, or visit our Blog for a more detailed technical analysis. Trade with care.
Analysis by
Anonymous Banker Team
Like | Share | Comment
In the past few weeks we have already traded
USDCAD pair on the first trendline re-test, but at the same time this technical element could still be useful to us. The big picture on daily chart is harmonic structure followed by corrective structure with ABC Pattern formation.✔ At the moment, we remain below an important resistance (not shown on chart), but if there is a bullish breakout during the first hours of trading, another bullish consolidation should appear, pushing the price to retest the trendline around the 1.3389 area.
✔ From a technical point of view and following the pair on intraday chart, it could be interesting to take a long position on pullback or corrective structure that will appear.
During the next hours/sessions, we will publish new updates, even on minor time frame in the section below, or visit our Blog for a more detailed technical analysis. Trade with care.
Analysis by
Anonymous Banker Team
Like | Share | Comment
노트
노트
📊 Bullish above the support area:노트
📈 Daily and Intraday resistance:노트
🔔 Intraday resistance:노트
🔔 Daily resistance:노트
...pullback in short term?거래청산: 타겟 닿음
✅ Daily Chart:노트
노트
💡 New Idea | Updates Daily Chart Analysis: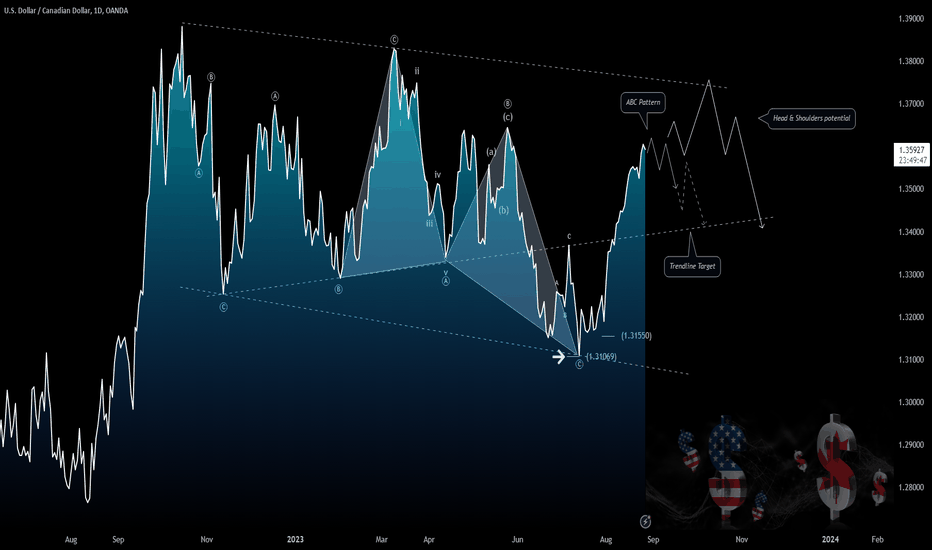
노트
💡 Trend is still bullish.
면책사항
해당 정보와 게시물은 금융, 투자, 트레이딩 또는 기타 유형의 조언이나 권장 사항으로 간주되지 않으며, 트레이딩뷰에서 제공하거나 보증하는 것이 아닙니다. 자세한 내용은 이용 약관을 참조하세요.
면책사항
해당 정보와 게시물은 금융, 투자, 트레이딩 또는 기타 유형의 조언이나 권장 사항으로 간주되지 않으며, 트레이딩뷰에서 제공하거나 보증하는 것이 아닙니다. 자세한 내용은 이용 약관을 참조하세요.