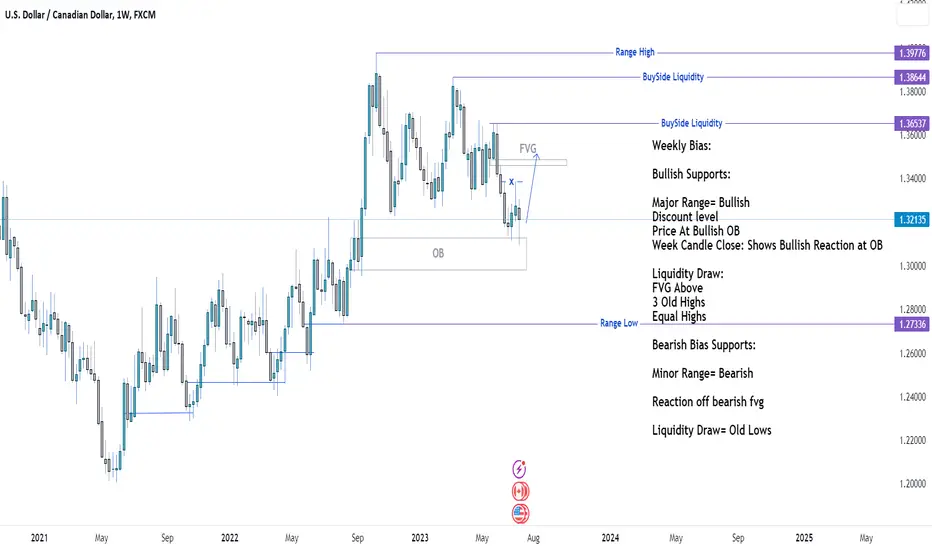

 USDCAD
 What Next For Usdcad In The 3rd Week Of July?
Weekly Bias:
To understand and know what the weekly bias is or will be, one has to take into considerations all the previous and current price action activities within our current price range.
Bullish Supporting Sentiments:
Major Range= Bullish
Price At Discount level
Price At Bullish OB
Week Candle Close: Shows Bullish Reaction at OB
Price Movements: Price has been respecting the bullish range order blocks mid-threshod for two years now.
Liquidity Draw:
FVG Above Current Price
3 Old Highs
2 Equal Highs
Bearish Bias Supporting Sentiments:
Minor Range= Bearish
Reaction off bearish fvg
Liquidity Draw= Old Lows
Possible liquidity grab below old lows to take out sellside liquidity before continuing the bullish move.
Summary:
Price has more reason to be bullish in the 3rd week of July and comings weeks than bearish.
There are two main reason price might be bearish in coming weeks, which are either for a sellside liquidity grab or complete reversal of the trend.
However, I will be favouring buys for now till there is a complete shift in market structure.
What do you see on your charts?
Drop your comments.
Don't forget to give me a like and follow me for future updates.

관련 발행물
면책사항
해당 정보와 게시물은 금융, 투자, 트레이딩 또는 기타 유형의 조언이나 권장 사항으로 간주되지 않으며, 트레이딩뷰에서 제공하거나 보증하는 것이 아닙니다. 자세한 내용은 이용 약관을 참조하세요.
관련 발행물
면책사항
해당 정보와 게시물은 금융, 투자, 트레이딩 또는 기타 유형의 조언이나 권장 사항으로 간주되지 않으며, 트레이딩뷰에서 제공하거나 보증하는 것이 아닙니다. 자세한 내용은 이용 약관을 참조하세요.