

In some cases, we cannot detect the main trend clearly. But there are patterns that are helpful, they temporarily show the trend. One of these patterns is Diagonal.
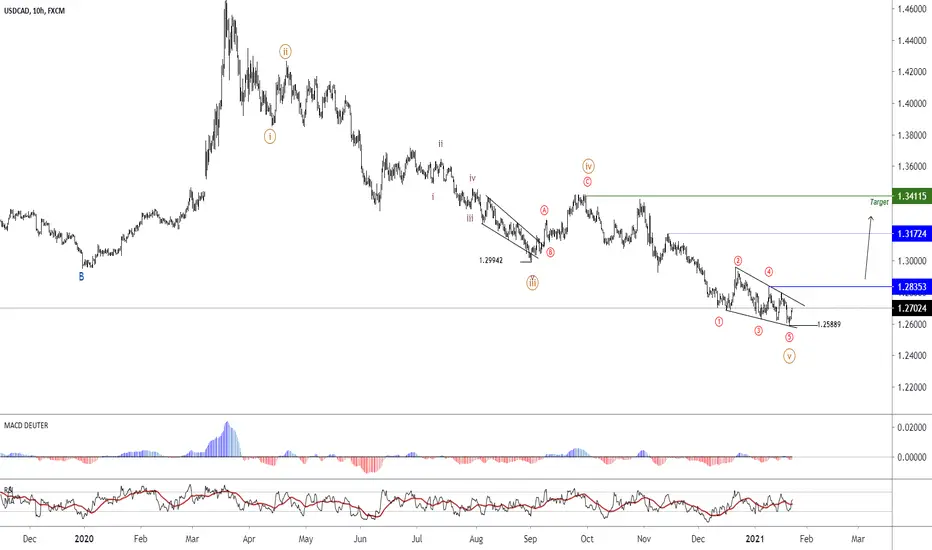
As you can see in the image, the Diagonal pattern is formed and we are waiting for the price to increase to the range of 1. 3411. To get the confirmation for the uptrend, the price should cross the range of 1.2835.
In addition, convergence is evident in RSI. This analysis will be violated by crossing the price from the range of 1.2588.
As you can see in the image, the Diagonal pattern is formed and we are waiting for the price to increase to the range of 1. 3411. To get the confirmation for the uptrend, the price should cross the range of 1.2835.
In addition, convergence is evident in RSI. This analysis will be violated by crossing the price from the range of 1.2588.

면책사항
해당 정보와 게시물은 금융, 투자, 트레이딩 또는 기타 유형의 조언이나 권장 사항으로 간주되지 않으며, 트레이딩뷰에서 제공하거나 보증하는 것이 아닙니다. 자세한 내용은 이용 약관을 참조하세요.
면책사항
해당 정보와 게시물은 금융, 투자, 트레이딩 또는 기타 유형의 조언이나 권장 사항으로 간주되지 않으며, 트레이딩뷰에서 제공하거나 보증하는 것이 아닙니다. 자세한 내용은 이용 약관을 참조하세요.