

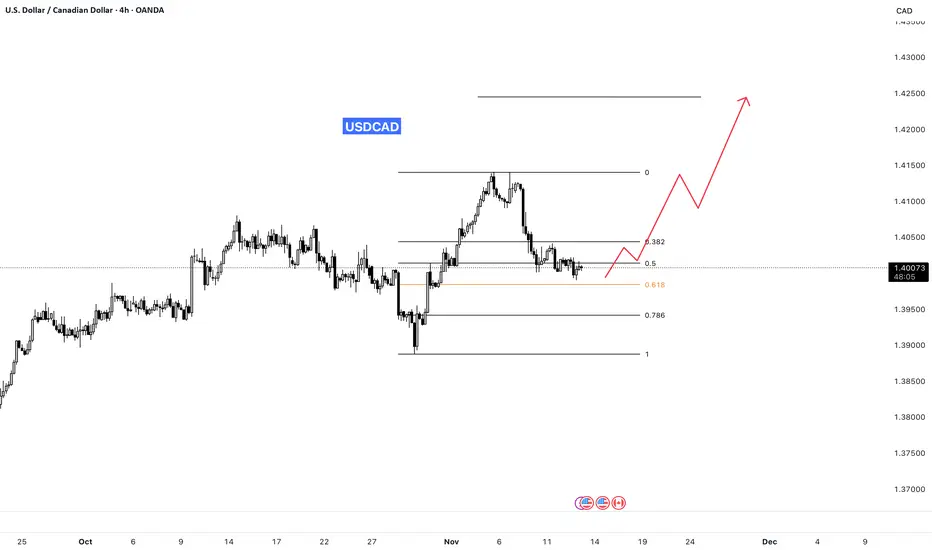
Identify Fibonacci Support Levels
Use Fibonacci retracement to find key support zones such as the 0.382, 0.5, and 0.618 levels where price often reacts or reverses.
Wait for Reversal Confirmation
Enter only after confirming a trend reversal on the 1-hour chart using candlestick patterns (like engulfing or pin bars), RSI divergence, or a structure break.
Maintain RRR of 1:3
Plan every trade with at least a 1:3 risk-to-reward ratio for every 1% you risk, aim to gain 3%.
Follow Strict Risk Management
Never risk more than 2% of your account balance on a single trade. Adjust your lot size based on stop-loss distance to protect your capital.
Use Fibonacci retracement to find key support zones such as the 0.382, 0.5, and 0.618 levels where price often reacts or reverses.
Wait for Reversal Confirmation
Enter only after confirming a trend reversal on the 1-hour chart using candlestick patterns (like engulfing or pin bars), RSI divergence, or a structure break.
Maintain RRR of 1:3
Plan every trade with at least a 1:3 risk-to-reward ratio for every 1% you risk, aim to gain 3%.
Follow Strict Risk Management
Never risk more than 2% of your account balance on a single trade. Adjust your lot size based on stop-loss distance to protect your capital.

면책사항
해당 정보와 게시물은 금융, 투자, 트레이딩 또는 기타 유형의 조언이나 권장 사항으로 간주되지 않으며, 트레이딩뷰에서 제공하거나 보증하는 것이 아닙니다. 자세한 내용은 이용 약관을 참조하세요.
면책사항
해당 정보와 게시물은 금융, 투자, 트레이딩 또는 기타 유형의 조언이나 권장 사항으로 간주되지 않으며, 트레이딩뷰에서 제공하거나 보증하는 것이 아닙니다. 자세한 내용은 이용 약관을 참조하세요.