

Hello Traders,
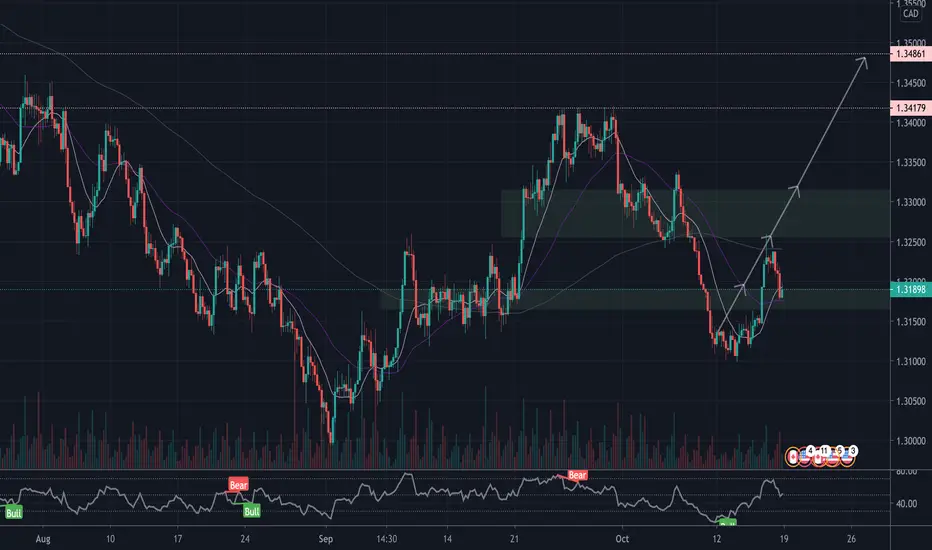
Here is the Top-Down Analysis of USDCAD (Monthly, Weekly, Daily for direction and 4H for entry) for
Week 43 - 19 Oct
M > After facing rejection at monthly support price moved up to test resistance level. Between these two levels price had created range in past. After a huge drop we expect a correction at least till 0.382 Fib level on last bearish impulse.
W> We saw an M formation and price moved up to test the neck and dropped again. We can see another M formation and price can move up to test its neck. Neck of M formation also coincides with monthly 0.382 Fib level.
D > Price has dropped lower than first LH of bullish impulse. As expected price faced rejection to the upside towards our target. However price reversed for a pull down from 0.5 Fib level on last bearish impulse. We expect this to be just a pull back during bullish move towards the target.
As per COT CAD saw addition of major Long and closure of Short positions with Short positions further reducing to least for current year, improving net positions (still in -ve). CXY further gained strength during the said week but weakened a bit last week.
We have been expecting CXY to strengthen for sometime however DXY is also pushing for its recovery. Hence a bullish move is certainly possible.
4H > Price dropped for a pull back and it should now continue with bullish move. We will continue with our last week's analysis which I will link with this update.
Pair Correlation > USDCAD has negative correlation with NZDJPY, GBPUSD, NZDUSD, CADJPY and AUDJPY.
This was my Idea and I hope you find it useful. If you find the analysis of help please leave a LIKE and FOLLOW for receiving all updates during the week. In the comment section share your view or ask questions.
Thank You
AP17FX

관련 발행물
면책사항
해당 정보와 게시물은 금융, 투자, 트레이딩 또는 기타 유형의 조언이나 권장 사항으로 간주되지 않으며, 트레이딩뷰에서 제공하거나 보증하는 것이 아닙니다. 자세한 내용은 이용 약관을 참조하세요.
면책사항
해당 정보와 게시물은 금융, 투자, 트레이딩 또는 기타 유형의 조언이나 권장 사항으로 간주되지 않으며, 트레이딩뷰에서 제공하거나 보증하는 것이 아닙니다. 자세한 내용은 이용 약관을 참조하세요.