

The ICE dollar index rose 7.3 percent from July to September, the biggest quarterly jump since 2015, according to Dow Jones.
It was up 3.2% in September.
The dollar's strength this year is due to both the Federal Reserve's rapid rise in the benchmark interest rate and the relative stability of the U.S. economy.

On the global timeframe we can see the potential for price movement. We see the USDCAD moving in a sideways range between the levels 1.468 - to 1.193. The last tested boundary is support, from which the price rebounded from the level and transition to the consolidation phase with the subsequent impulse. In the long term I expect the continuation of growth.
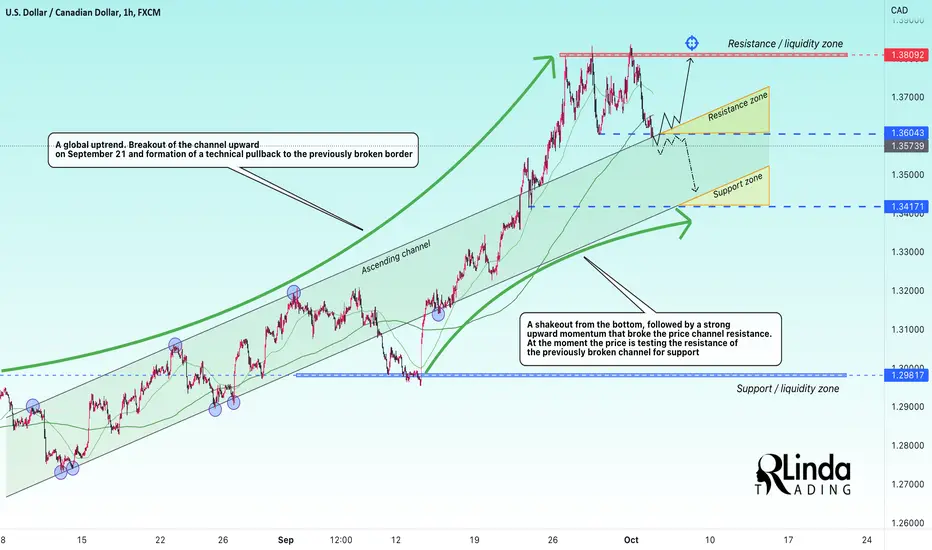
From the technical analysis viewpoint we are seeing an accelerated rally, which is caused by a break-up of the uptrend channel resistance, but the price meets the resistance limit area at 1.3800, after which the price forms the base support at 1.36000 and makes a retest to that area. I suppose if the price is able to resist above the support level, then there are all chances for the retest of resistance, but also expect breakdown of the support and return of the price to the ascending channel, after what the technical fallback to the support zone can follow.
Regards to R. Linda!
It was up 3.2% in September.
The dollar's strength this year is due to both the Federal Reserve's rapid rise in the benchmark interest rate and the relative stability of the U.S. economy.
On the global timeframe we can see the potential for price movement. We see the USDCAD moving in a sideways range between the levels 1.468 - to 1.193. The last tested boundary is support, from which the price rebounded from the level and transition to the consolidation phase with the subsequent impulse. In the long term I expect the continuation of growth.
From the technical analysis viewpoint we are seeing an accelerated rally, which is caused by a break-up of the uptrend channel resistance, but the price meets the resistance limit area at 1.3800, after which the price forms the base support at 1.36000 and makes a retest to that area. I suppose if the price is able to resist above the support level, then there are all chances for the retest of resistance, but also expect breakdown of the support and return of the price to the ascending channel, after what the technical fallback to the support zone can follow.
Regards to R. Linda!

🌹TRADING is a CASINO💔!?
NO‼️
Join me, I'll guide you to PROFITABLE TRADING💵!
(don't copy, click on the links!)
🟢Telegram Channel: telegram.me/RLindaTrade
🧿 Web: rlinda.com
🔴Contact: telegram.me/RLindaSignals
NO‼️
Join me, I'll guide you to PROFITABLE TRADING💵!
(don't copy, click on the links!)
🟢Telegram Channel: telegram.me/RLindaTrade
🧿 Web: rlinda.com
🔴Contact: telegram.me/RLindaSignals
관련 발행물
면책사항
해당 정보와 게시물은 금융, 투자, 트레이딩 또는 기타 유형의 조언이나 권장 사항으로 간주되지 않으며, 트레이딩뷰에서 제공하거나 보증하는 것이 아닙니다. 자세한 내용은 이용 약관을 참조하세요.
🌹TRADING is a CASINO💔!?
NO‼️
Join me, I'll guide you to PROFITABLE TRADING💵!
(don't copy, click on the links!)
🟢Telegram Channel: telegram.me/RLindaTrade
🧿 Web: rlinda.com
🔴Contact: telegram.me/RLindaSignals
NO‼️
Join me, I'll guide you to PROFITABLE TRADING💵!
(don't copy, click on the links!)
🟢Telegram Channel: telegram.me/RLindaTrade
🧿 Web: rlinda.com
🔴Contact: telegram.me/RLindaSignals
관련 발행물
면책사항
해당 정보와 게시물은 금융, 투자, 트레이딩 또는 기타 유형의 조언이나 권장 사항으로 간주되지 않으며, 트레이딩뷰에서 제공하거나 보증하는 것이 아닙니다. 자세한 내용은 이용 약관을 참조하세요.