

Hi guys,
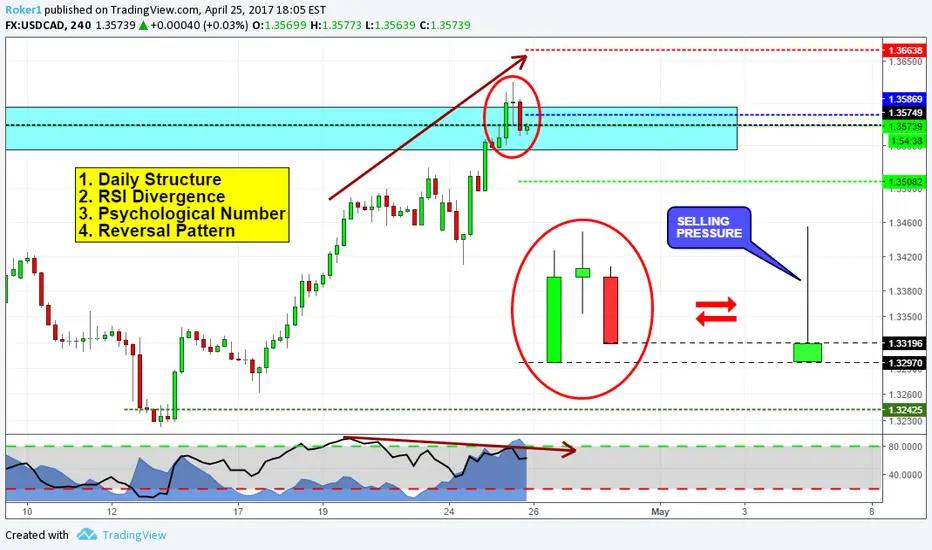
on USDCAD price has reached a key resistance area, therefore i were looking for a potential selling opportunity at this level. In the 4hr chart you can see we have huge divergence, along with a psychological number that could also provide some resistance.
But most importantly, price has formed a reversal pattern being the sequence of those 3 candles at that structure point: price broke through that level and after that break formed a doji candle followed by an engulfing. This signifies a lot of selling pressure.
Thus, i'm waiting to see a small pullback in order to get a better entry and therefore a better risk to reward ratio.
Stop above the highs, target1 at roughly 1:1 RR, target2 to be determined.
If you want to share your view, or ask questions, feel free to comment below.
Otherwise, see you in the next chart!
액티브 트레이드

면책사항
해당 정보와 게시물은 금융, 투자, 트레이딩 또는 기타 유형의 조언이나 권장 사항으로 간주되지 않으며, 트레이딩뷰에서 제공하거나 보증하는 것이 아닙니다. 자세한 내용은 이용 약관을 참조하세요.
면책사항
해당 정보와 게시물은 금융, 투자, 트레이딩 또는 기타 유형의 조언이나 권장 사항으로 간주되지 않으며, 트레이딩뷰에서 제공하거나 보증하는 것이 아닙니다. 자세한 내용은 이용 약관을 참조하세요.