

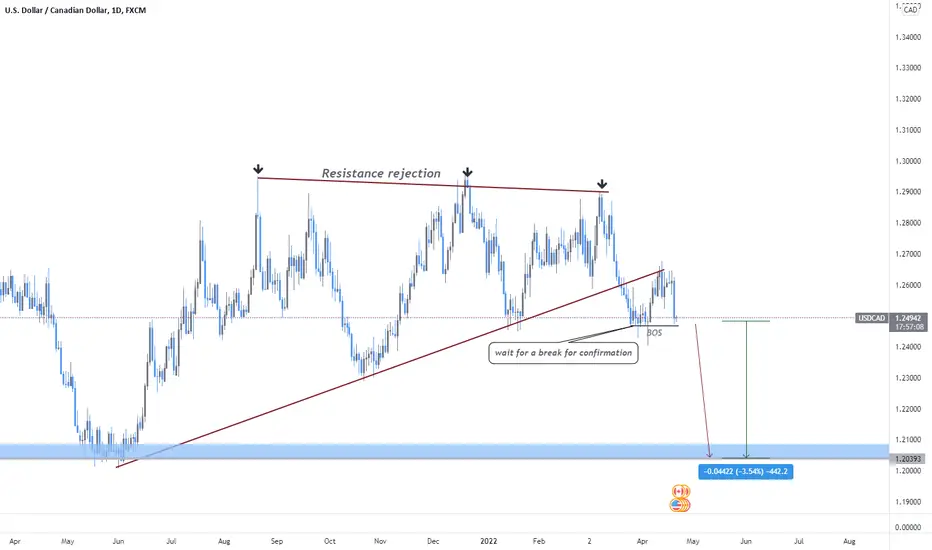
Ascending Triangle
An ascending triangle is a type of triangle chart pattern that occurs when there is a resistance level and a slope of higher lows.
What happens during this time is that there is a certain level that the buyers cannot seem to exceed. However, they are gradually starting to push the price up as evidenced by the higher lows.
you can see that the buyers are starting to gain strength because they are making higher lows.
They keep putting pressure on that resistance level and as a result, a breakout is bound
In this scenario, the buyers lost the battle and the price proceeded to dive! You can see that the drop was approximately the same distance as the height of the triangle formation.
A break below 1.24596, could drive price lower

면책사항
해당 정보와 게시물은 금융, 투자, 트레이딩 또는 기타 유형의 조언이나 권장 사항으로 간주되지 않으며, 트레이딩뷰에서 제공하거나 보증하는 것이 아닙니다. 자세한 내용은 이용 약관을 참조하세요.
면책사항
해당 정보와 게시물은 금융, 투자, 트레이딩 또는 기타 유형의 조언이나 권장 사항으로 간주되지 않으며, 트레이딩뷰에서 제공하거나 보증하는 것이 아닙니다. 자세한 내용은 이용 약관을 참조하세요.