

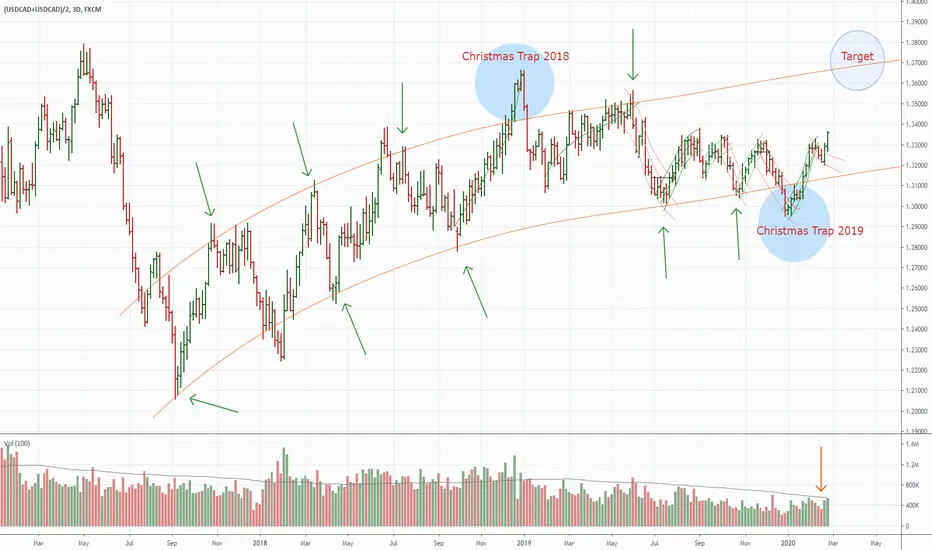
We have here orange lines of the major trend-channel (orange lines). Study the cases, when USDCAD did bounce with orange lines (I used green arrows to outline reversals).
Note:
- Christmas Trap in 2018. Price made the fake breakout but reversed down in January/2019.
- Christmas Trap in 2019. Price made the fake breakdown but reversed up in January/2020.
- The recent indication in volume is bullish - this is No_Supply arrow (diminishing volume amid a decline in price). A lack of traders wants to buy CAD. That is why the current movement has a bullish power.
In the global view, I project a long-time target around 1.37.
Note:
- Christmas Trap in 2018. Price made the fake breakout but reversed down in January/2019.
- Christmas Trap in 2019. Price made the fake breakdown but reversed up in January/2020.
- The recent indication in volume is bullish - this is No_Supply arrow (diminishing volume amid a decline in price). A lack of traders wants to buy CAD. That is why the current movement has a bullish power.
In the global view, I project a long-time target around 1.37.

Supply And Demand Trading .com
면책사항
해당 정보와 게시물은 금융, 투자, 트레이딩 또는 기타 유형의 조언이나 권장 사항으로 간주되지 않으며, 트레이딩뷰에서 제공하거나 보증하는 것이 아닙니다. 자세한 내용은 이용 약관을 참조하세요.
Supply And Demand Trading .com
면책사항
해당 정보와 게시물은 금융, 투자, 트레이딩 또는 기타 유형의 조언이나 권장 사항으로 간주되지 않으며, 트레이딩뷰에서 제공하거나 보증하는 것이 아닙니다. 자세한 내용은 이용 약관을 참조하세요.