

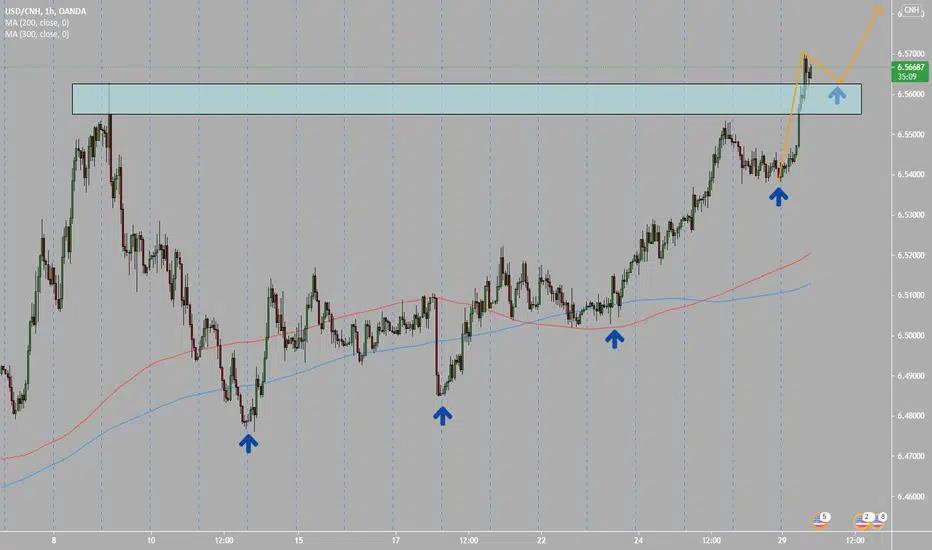
+ At monthly candle chart we have 0.764 Fibonacci retracement level. This is good for buy signal.
+ Previous week candle was bullish. This is good for buy signal.
+ At daily candle timeframe market show us bullish signals at 1 hour timeframe.
Idea is wait for one hour candle timeframe closing at the highest point and go with the crowd forward.
+ Previous week candle was bullish. This is good for buy signal.
+ At daily candle timeframe market show us bullish signals at 1 hour timeframe.
Idea is wait for one hour candle timeframe closing at the highest point and go with the crowd forward.

면책사항
해당 정보와 게시물은 금융, 투자, 트레이딩 또는 기타 유형의 조언이나 권장 사항으로 간주되지 않으며, 트레이딩뷰에서 제공하거나 보증하는 것이 아닙니다. 자세한 내용은 이용 약관을 참조하세요.
면책사항
해당 정보와 게시물은 금융, 투자, 트레이딩 또는 기타 유형의 조언이나 권장 사항으로 간주되지 않으며, 트레이딩뷰에서 제공하거나 보증하는 것이 아닙니다. 자세한 내용은 이용 약관을 참조하세요.