

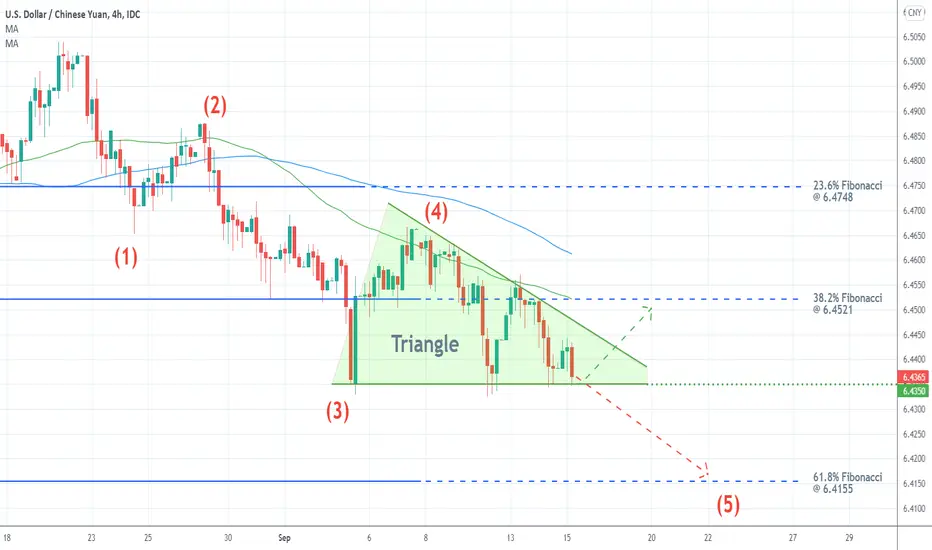
The price of USDCNY is establishing a new downtrend. It is structured as a 1-5 impulse wave pattern, as postulated by the Elliott Wave Theory. After having broken down below the 38.2 per cent Fibonacci retracement level, the price action is currently testing the lower limit of the Triangle.
If it manages to break down below it as well, then the price action would be able to head towards the 61.8 per cent Fibonacci. However, a rebound from the lower limit of the Triangle would see the price action testing the 38.2 per cent Fibonacci from below. The latter is currently converging with the 50-day MA (in green), making it an even more powerful resistance level.
If it manages to break down below it as well, then the price action would be able to head towards the 61.8 per cent Fibonacci. However, a rebound from the lower limit of the Triangle would see the price action testing the 38.2 per cent Fibonacci from below. The latter is currently converging with the 50-day MA (in green), making it an even more powerful resistance level.

관련 발행물
면책사항
해당 정보와 게시물은 금융, 투자, 트레이딩 또는 기타 유형의 조언이나 권장 사항으로 간주되지 않으며, 트레이딩뷰에서 제공하거나 보증하는 것이 아닙니다. 자세한 내용은 이용 약관을 참조하세요.
면책사항
해당 정보와 게시물은 금융, 투자, 트레이딩 또는 기타 유형의 조언이나 권장 사항으로 간주되지 않으며, 트레이딩뷰에서 제공하거나 보증하는 것이 아닙니다. 자세한 내용은 이용 약관을 참조하세요.