

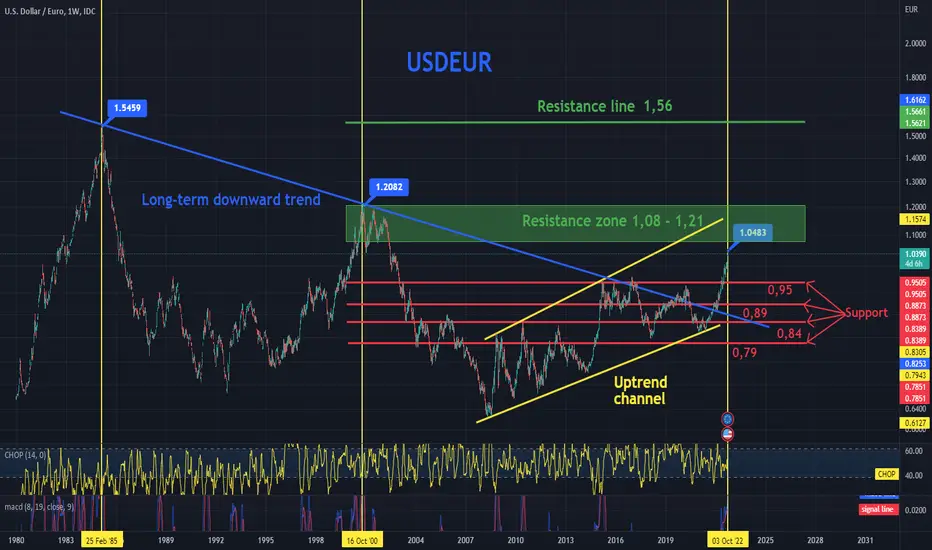
Hello everyone, let's take a look at the USDEUR weekend chart as you can see the price has been moving in the uptrend channel since 2008 and has broken the downtrend line that has been going on since 1985.
Let's start with the designation of the support line and as you can see the first support in the near future is 0.95, if the support breaks down, the next support is 0.89, 0.84 and 0.79.
Now let's move from the resistance line as you can see, the first resistance is the support zone from 1.08 to 1.21, if you manage to break it, the next resistance will be 1.56.
Looking at the CHOP indicator, we can see that in the 1W interval, most of the energy has been used, but we still have some more for the next move, and the MACD indicator confirms the current upward trend.
Let's start with the designation of the support line and as you can see the first support in the near future is 0.95, if the support breaks down, the next support is 0.89, 0.84 and 0.79.
Now let's move from the resistance line as you can see, the first resistance is the support zone from 1.08 to 1.21, if you manage to break it, the next resistance will be 1.56.
Looking at the CHOP indicator, we can see that in the 1W interval, most of the energy has been used, but we still have some more for the next move, and the MACD indicator confirms the current upward trend.

면책사항
해당 정보와 게시물은 금융, 투자, 트레이딩 또는 기타 유형의 조언이나 권장 사항으로 간주되지 않으며, 트레이딩뷰에서 제공하거나 보증하는 것이 아닙니다. 자세한 내용은 이용 약관을 참조하세요.
면책사항
해당 정보와 게시물은 금융, 투자, 트레이딩 또는 기타 유형의 조언이나 권장 사항으로 간주되지 않으며, 트레이딩뷰에서 제공하거나 보증하는 것이 아닙니다. 자세한 내용은 이용 약관을 참조하세요.