

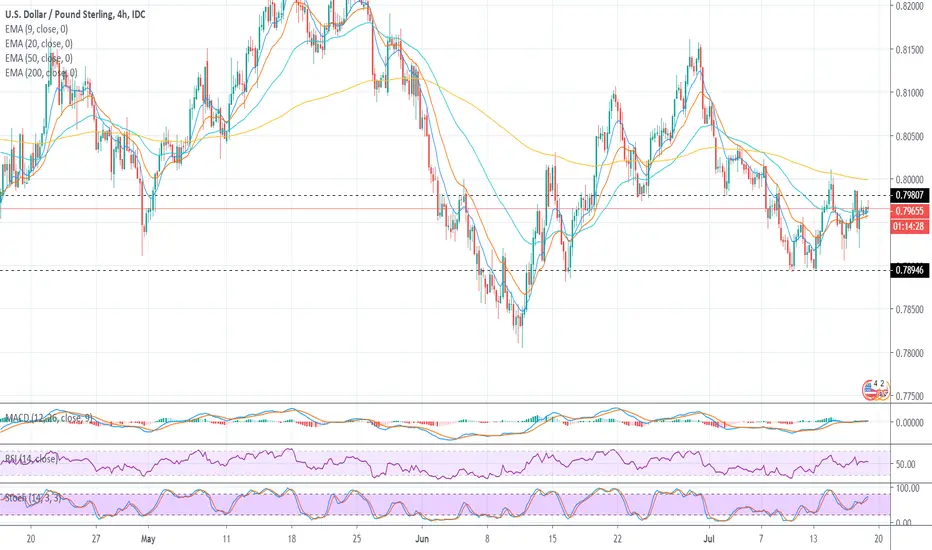
We can see an ascending triangle forming here on USDGBP.
This formation means that buyers are out performing sellers.
As you can see the buyers keep pushing there lows higher but sellers cant push there highs lower.
You can see my predictions on the chart with the arrow.
I will be getting in on the retest of resistance turned support/the primary line of the triangle.
Pretty major resistance as 0.79807 but i'm pretty sure price will brake through.
There could be a great opportunity to catch the move after this happens, will probably be sometime next week.
All indicators also point to a break.
Pretty bullish fundamentals out this week for both sides of this pair so it will be the data that comes out next week that is really going to dictate where this one goes.
Stay tuned!
This formation means that buyers are out performing sellers.
As you can see the buyers keep pushing there lows higher but sellers cant push there highs lower.
You can see my predictions on the chart with the arrow.
I will be getting in on the retest of resistance turned support/the primary line of the triangle.
Pretty major resistance as 0.79807 but i'm pretty sure price will brake through.
There could be a great opportunity to catch the move after this happens, will probably be sometime next week.
All indicators also point to a break.
Pretty bullish fundamentals out this week for both sides of this pair so it will be the data that comes out next week that is really going to dictate where this one goes.
Stay tuned!

면책사항
해당 정보와 게시물은 금융, 투자, 트레이딩 또는 기타 유형의 조언이나 권장 사항으로 간주되지 않으며, 트레이딩뷰에서 제공하거나 보증하는 것이 아닙니다. 자세한 내용은 이용 약관을 참조하세요.
면책사항
해당 정보와 게시물은 금융, 투자, 트레이딩 또는 기타 유형의 조언이나 권장 사항으로 간주되지 않으며, 트레이딩뷰에서 제공하거나 보증하는 것이 아닙니다. 자세한 내용은 이용 약관을 참조하세요.