

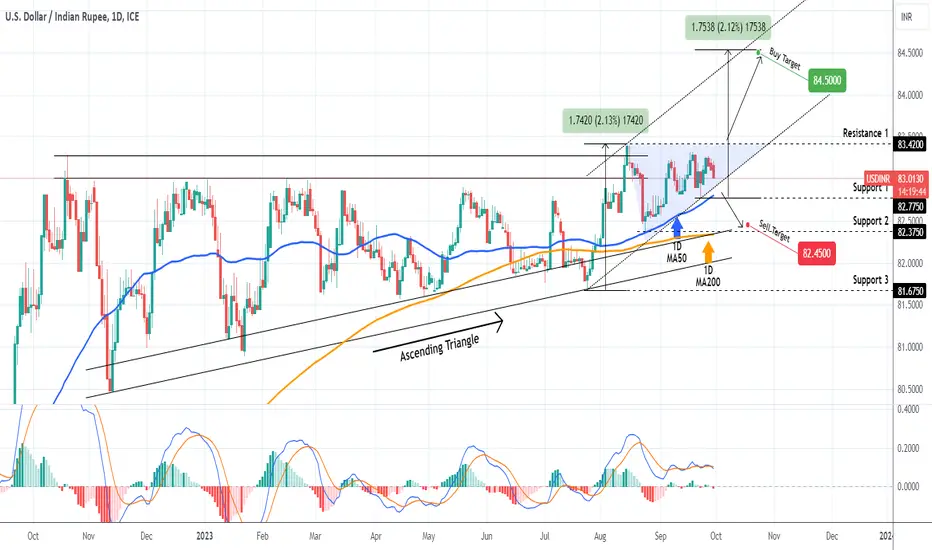
The USDINR pair is trading inside a 1.5 month Triangle (blue), following the upward break-out of the 1 year Ascending Triangle. The 1D MA50 (blue trend-line) has been supporting for 2 months and as long as it holds, buy when the price breaks above Resistance 1 (83.4200). The target can be 84.500, representing a +2.13% leg extension on a potential emerging Channel Up. If the 1D MA50 breaks, we will sell instead and target the 1D MA200 (orange trend-line) at 82.4500, which is marginally above Support 2.
-------------------------------------------------------------------------------
** Please LIKE 👍, FOLLOW ✅, SHARE 🙌 and COMMENT ✍ if you enjoy this idea! Also share your ideas and charts in the comments section below! **
-------------------------------------------------------------------------------
💸💸💸💸💸💸
👇 👇 👇 👇 👇 👇
-------------------------------------------------------------------------------
** Please LIKE 👍, FOLLOW ✅, SHARE 🙌 and COMMENT ✍ if you enjoy this idea! Also share your ideas and charts in the comments section below! **
-------------------------------------------------------------------------------
💸💸💸💸💸💸
👇 👇 👇 👇 👇 👇

I trade Crypto, Forex, Indices & Commodities on PrimeXBT — all from one account with TradingView charts 👉 tradingshot.short.gy/PrimeXBT
I also use TradeNation for fixed spreads & zero commission 👉 tradingshot.short.gy/Tradenation
I also use TradeNation for fixed spreads & zero commission 👉 tradingshot.short.gy/Tradenation
면책사항
해당 정보와 게시물은 금융, 투자, 트레이딩 또는 기타 유형의 조언이나 권장 사항으로 간주되지 않으며, 트레이딩뷰에서 제공하거나 보증하는 것이 아닙니다. 자세한 내용은 이용 약관을 참조하세요.
I trade Crypto, Forex, Indices & Commodities on PrimeXBT — all from one account with TradingView charts 👉 tradingshot.short.gy/PrimeXBT
I also use TradeNation for fixed spreads & zero commission 👉 tradingshot.short.gy/Tradenation
I also use TradeNation for fixed spreads & zero commission 👉 tradingshot.short.gy/Tradenation
면책사항
해당 정보와 게시물은 금융, 투자, 트레이딩 또는 기타 유형의 조언이나 권장 사항으로 간주되지 않으며, 트레이딩뷰에서 제공하거나 보증하는 것이 아닙니다. 자세한 내용은 이용 약관을 참조하세요.