

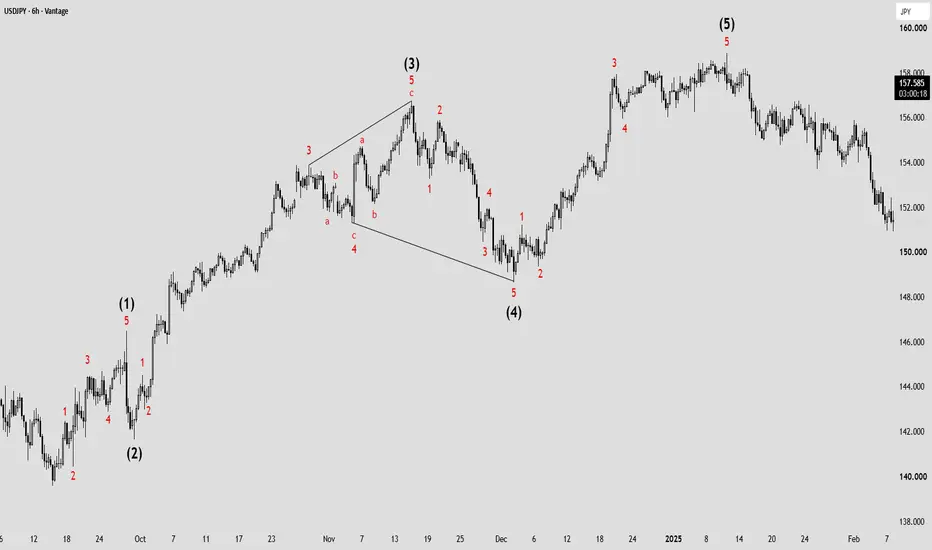
🇺🇸🇯🇵 USDJPY – 6H | Deep Elliott Wave Lesson | From the Simple Chart to the Full Count Step by Step
Today we have a very detailed and deep lesson in Elliott Wave.
My goal is not just for you to see the numbers on the chart. My goal is for you to understand why the count looks like this, how to build the count yourself from scratch, and how to distinguish between a correct count and a weak one.
We will go together through four charts of the same move on USDJPY 6-hour timeframe, from the simplest chart to the most detailed one.
Each chart represents a stage in building the wave count.
---
Chart 1 – The Main Count Only (The Big Picture)

This is the most important chart you must learn to see first.
In this chart we only see the five main waves:
(1) → (2) → (3) → (4) → (5)
There are no internal subdivisions, no a-b-c, no channels. Just the basic structure.
Why do we start this way?
Because most beginners (and even some professionals) jump straight into counting the small waves and then get lost. The result is a wrong wave count, or they keep changing the count every short while.
The golden rule:
The first thing you must see is the big five-wave structure.
Look at the move with me:
- Wave (1): Strong rally from the bottom, clearly impulsive.
- Wave (2): Clear correction where price dropped noticeably.
- Wave (3): The longest and strongest upward wave in the entire structure.
- Wave (4): Relatively deep correction, price dropped clearly.
- Wave (5): The final rally that took price to the ultimate high near 158.50 approximately.
If you cannot clearly see these five waves on the chart, the entire count is weak and not worth continuing with.
This chart teaches you to “see the forest before the trees.”
---
Chart 2 – Adding the Basic Internal Subdivisions

Now we move one step forward.
In this chart we started adding the internal subdivisions inside the larger waves.
Notice that:
- Wave (1) itself subdivided into 5 smaller waves.
- Wave (3) has clear subdivisions.
- Wave (4) showed a more detailed correction.
Why is this step important?
Because Elliott Wave is built on the principle of self-similarity (Fractal). This means every large impulsive wave must be made of 5 smaller waves, and every large corrective wave must be made of 3 waves (or a complex pattern).
If you find a large wave that is supposed to be impulsive, but when you look inside it you only find 3 waves, then there is a serious problem in the count.
This stage is where you start “testing” the validity of the main count you saw in the first chart.
---
Chart 3 – Deeper Details + Starting to Apply Advanced Rules

Now we enter a higher level.
In this chart we see:
- Clearer subdivisions inside wave (3).
- Wave (4) correction became more clear and complex.
- Sub-wave numbers (1)(2)(3)(4)(5) appeared in certain parts.
Here we start applying one of the most important rules that separates an average analyst from a strong one:
The relationship rule between wave 1-2 and wave 3-4 (Depth Alternation Rule)
This is a golden rule, and many people do not apply it:
- If wave 1-2 comes short and quick, wave 3-4 will often be a violent and deep correction.
- And the exact opposite is also true: if wave 1-2 comes as a deep and long correction, wave 3-4 will often be a quick and shallow correction.
Why does this happen?
Because the market always tends toward alternation. If the first correction is simple, the second correction tends to be more complex or deeper, and vice versa.
This rule gives you an early expectation of the shape of wave 4 before it fully forms.
In the current chart, notice how wave (2) was clear and relatively deep, while wave (4) came differently in both depth and time.
---
Chart 4 – The Complete Count with All Details and Channels

This chart is the final complete count that we actually use in professional analysis.
It contains everything:
- The main waves (1)(2)(3)(4)(5)
- Internal subdivisions of every wave
- a-b-c type corrections
- Price channels that help determine wave endings
- Relationships between the waves
Notice especially:
- Inside wave (3) there are clear internal corrections (a-b-c).
- Wave (4) came as a more complex correction rather than a simple zigzag.
- Wave (5) completed the rally and reached the final area.
The price channels in this chart are very important because they give you potential targets and confirm that the count is still valid.
---
Secrets of Correction Types (One of the Most Important Parts of the Lesson)
This point is considered by many professionals as one of the “secrets” of correct counting, because it helps you distinguish between a strong count and a weak count from the first look.
1. Wave 1-2 (The first correction):
Usually you will not see:
- Diagonal
- Triangle
- Complex or combination patterns
The most common patterns in wave 1-2 are:
- Zigzag
- Simple Flat
Meaning a relatively “clean” and simple correction.
If you see a triangle or diagonal in wave 2, there is often a problem in the count, or at least you should be very careful.
2. Wave 3-4 (The second correction):
Here the situation is completely different.
Wave 4 is often more complex, and the most common patterns in it are:
- Flat (in its various forms)
- Triangle
- Sometimes combination corrections
This is why we often see wave 4 moving sideways, taking more time, or being more complex than wave 2.
If you understand this point well, you will be able to anticipate the shape of wave 4 before it completes, and this gives you a big advantage in analysis.
---
How to Build the Count Yourself Step by Step (Practical Method)
1. Start with the big picture: Can you clearly see 5 main waves?
2. Identify wave (3): It should usually be the strongest and longest.
3. Look at wave (2) and wave (4): Is there alternation in depth and time?
4. Go into the internal subdivisions: Every impulsive wave must be 5, every corrective wave must be 3 or complex.
5. Apply the correction type rule (1-2 simple, 3-4 more complex).
6. Use price channels for confirmation.
7. If the price action violates the basic rules, do not force the count. Change it.
---
Common Mistakes You Must Avoid
- Counting the small waves before seeing the big structure.
- Forcing the count just to make it “look nice.”
- Forgetting the alternation rule between wave 2 and wave 4.
- Placing a triangle or diagonal in wave 2 without strong justification.
- Considering any rally as 5 waves without checking relative strength.
---
Final Summary
Wave counting is not random art. It is a system with clear rules.
The four charts we explained represent the stages of building the count:
- Chart 1: The big structure only
- Chart 2: Adding the basic subdivisions
- Chart 3: Deeper details + applying the rules
- Chart 4: The complete count with all tools
Always start from the simple, then move to the detailed.
And never forget:
- Short wave 1-2 → often violent wave 3-4
- Deep wave 1-2 → often quick wave 3-4
- Wave 1-2 is usually Zigzag or Flat
- Wave 3-4 is usually Flat or Triangle
If you apply these rules consistently, your analysis level will rise significantly.
Watch the structure, and do not force the count on the chart. The market decides, not you.
---
⚠️ Disclaimer
This lesson is purely educational and is based on Elliott Wave Theory and price action reading. It does not represent any financial advice or a direct call to buy or sell.
The wave count is subject to change as market movement develops, and levels and targets may differ if the structure changes.
Capital management and risk management are the full responsibility of the trader.
Trade with a plan. Trade with discipline. 📈
Today we have a very detailed and deep lesson in Elliott Wave.
My goal is not just for you to see the numbers on the chart. My goal is for you to understand why the count looks like this, how to build the count yourself from scratch, and how to distinguish between a correct count and a weak one.
We will go together through four charts of the same move on USDJPY 6-hour timeframe, from the simplest chart to the most detailed one.
Each chart represents a stage in building the wave count.
---
Chart 1 – The Main Count Only (The Big Picture)
This is the most important chart you must learn to see first.
In this chart we only see the five main waves:
(1) → (2) → (3) → (4) → (5)
There are no internal subdivisions, no a-b-c, no channels. Just the basic structure.
Why do we start this way?
Because most beginners (and even some professionals) jump straight into counting the small waves and then get lost. The result is a wrong wave count, or they keep changing the count every short while.
The golden rule:
The first thing you must see is the big five-wave structure.
Look at the move with me:
- Wave (1): Strong rally from the bottom, clearly impulsive.
- Wave (2): Clear correction where price dropped noticeably.
- Wave (3): The longest and strongest upward wave in the entire structure.
- Wave (4): Relatively deep correction, price dropped clearly.
- Wave (5): The final rally that took price to the ultimate high near 158.50 approximately.
If you cannot clearly see these five waves on the chart, the entire count is weak and not worth continuing with.
This chart teaches you to “see the forest before the trees.”
---
Chart 2 – Adding the Basic Internal Subdivisions
Now we move one step forward.
In this chart we started adding the internal subdivisions inside the larger waves.
Notice that:
- Wave (1) itself subdivided into 5 smaller waves.
- Wave (3) has clear subdivisions.
- Wave (4) showed a more detailed correction.
Why is this step important?
Because Elliott Wave is built on the principle of self-similarity (Fractal). This means every large impulsive wave must be made of 5 smaller waves, and every large corrective wave must be made of 3 waves (or a complex pattern).
If you find a large wave that is supposed to be impulsive, but when you look inside it you only find 3 waves, then there is a serious problem in the count.
This stage is where you start “testing” the validity of the main count you saw in the first chart.
---
Chart 3 – Deeper Details + Starting to Apply Advanced Rules
Now we enter a higher level.
In this chart we see:
- Clearer subdivisions inside wave (3).
- Wave (4) correction became more clear and complex.
- Sub-wave numbers (1)(2)(3)(4)(5) appeared in certain parts.
Here we start applying one of the most important rules that separates an average analyst from a strong one:
The relationship rule between wave 1-2 and wave 3-4 (Depth Alternation Rule)
This is a golden rule, and many people do not apply it:
- If wave 1-2 comes short and quick, wave 3-4 will often be a violent and deep correction.
- And the exact opposite is also true: if wave 1-2 comes as a deep and long correction, wave 3-4 will often be a quick and shallow correction.
Why does this happen?
Because the market always tends toward alternation. If the first correction is simple, the second correction tends to be more complex or deeper, and vice versa.
This rule gives you an early expectation of the shape of wave 4 before it fully forms.
In the current chart, notice how wave (2) was clear and relatively deep, while wave (4) came differently in both depth and time.
---
Chart 4 – The Complete Count with All Details and Channels
This chart is the final complete count that we actually use in professional analysis.
It contains everything:
- The main waves (1)(2)(3)(4)(5)
- Internal subdivisions of every wave
- a-b-c type corrections
- Price channels that help determine wave endings
- Relationships between the waves
Notice especially:
- Inside wave (3) there are clear internal corrections (a-b-c).
- Wave (4) came as a more complex correction rather than a simple zigzag.
- Wave (5) completed the rally and reached the final area.
The price channels in this chart are very important because they give you potential targets and confirm that the count is still valid.
---
Secrets of Correction Types (One of the Most Important Parts of the Lesson)
This point is considered by many professionals as one of the “secrets” of correct counting, because it helps you distinguish between a strong count and a weak count from the first look.
1. Wave 1-2 (The first correction):
Usually you will not see:
- Diagonal
- Triangle
- Complex or combination patterns
The most common patterns in wave 1-2 are:
- Zigzag
- Simple Flat
Meaning a relatively “clean” and simple correction.
If you see a triangle or diagonal in wave 2, there is often a problem in the count, or at least you should be very careful.
2. Wave 3-4 (The second correction):
Here the situation is completely different.
Wave 4 is often more complex, and the most common patterns in it are:
- Flat (in its various forms)
- Triangle
- Sometimes combination corrections
This is why we often see wave 4 moving sideways, taking more time, or being more complex than wave 2.
If you understand this point well, you will be able to anticipate the shape of wave 4 before it completes, and this gives you a big advantage in analysis.
---
How to Build the Count Yourself Step by Step (Practical Method)
1. Start with the big picture: Can you clearly see 5 main waves?
2. Identify wave (3): It should usually be the strongest and longest.
3. Look at wave (2) and wave (4): Is there alternation in depth and time?
4. Go into the internal subdivisions: Every impulsive wave must be 5, every corrective wave must be 3 or complex.
5. Apply the correction type rule (1-2 simple, 3-4 more complex).
6. Use price channels for confirmation.
7. If the price action violates the basic rules, do not force the count. Change it.
---
Common Mistakes You Must Avoid
- Counting the small waves before seeing the big structure.
- Forcing the count just to make it “look nice.”
- Forgetting the alternation rule between wave 2 and wave 4.
- Placing a triangle or diagonal in wave 2 without strong justification.
- Considering any rally as 5 waves without checking relative strength.
---
Final Summary
Wave counting is not random art. It is a system with clear rules.
The four charts we explained represent the stages of building the count:
- Chart 1: The big structure only
- Chart 2: Adding the basic subdivisions
- Chart 3: Deeper details + applying the rules
- Chart 4: The complete count with all tools
Always start from the simple, then move to the detailed.
And never forget:
- Short wave 1-2 → often violent wave 3-4
- Deep wave 1-2 → often quick wave 3-4
- Wave 1-2 is usually Zigzag or Flat
- Wave 3-4 is usually Flat or Triangle
If you apply these rules consistently, your analysis level will rise significantly.
Watch the structure, and do not force the count on the chart. The market decides, not you.
---
⚠️ Disclaimer
This lesson is purely educational and is based on Elliott Wave Theory and price action reading. It does not represent any financial advice or a direct call to buy or sell.
The wave count is subject to change as market movement develops, and levels and targets may differ if the structure changes.
Capital management and risk management are the full responsibility of the trader.
Trade with a plan. Trade with discipline. 📈

My personal account, contact me t.me/pine_astro
면책사항
해당 정보와 게시물은 금융, 투자, 트레이딩 또는 기타 유형의 조언이나 권장 사항으로 간주되지 않으며, 트레이딩뷰에서 제공하거나 보증하는 것이 아닙니다. 자세한 내용은 이용 약관을 참조하세요.
My personal account, contact me t.me/pine_astro
면책사항
해당 정보와 게시물은 금융, 투자, 트레이딩 또는 기타 유형의 조언이나 권장 사항으로 간주되지 않으며, 트레이딩뷰에서 제공하거나 보증하는 것이 아닙니다. 자세한 내용은 이용 약관을 참조하세요.