

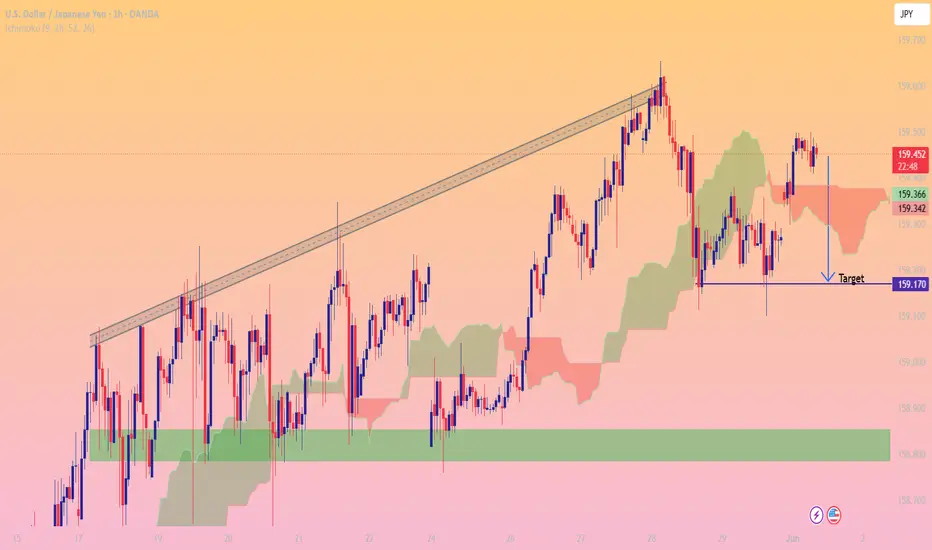
This 1-hour USD/JPY chart with the Ichimoku Cloud shows a strong bullish trend that has recently lost momentum after reaching a swing high near 159.60. The pair advanced steadily within a rising channel (gray trendline structure) before breaking below the channel support, signaling weakening bullish strength.
Following the breakdown, price entered a consolidation phase around the Ichimoku Cloud. Recent candles show repeated rejection near the 159.45–159.50 resistance area, while failing to establish new highs. This suggests sellers are beginning to gain control in the short term.
The highlighted blue horizontal level at 159.170 represents a key support zone and the projected downside target. The bearish scenario anticipates a continuation of the pullback from current levels toward this support area.
**Target:** 🎯 **159.170**
* Current Price: **159.451**
* Downside Target: **159.170**
* Potential Move: Approximately **28 pips**
* Immediate Resistance: **159.45–159.50**
* Key Support: **159.170**
* Additional Support Zone: **158.80–158.85** (green demand area)
* Bearish Bias Valid Below: **159.50**
* Invalidation: A sustained breakout above **159.50–159.60** would weaken the bearish outlook and could signal a resumption of the broader uptrend.
**Trade Idea:**
The chart suggests a short-term bearish correction within a larger bullish trend. As long as USD/JPY remains below the recent resistance zone and struggles to reclaim the broken ascending channel, price may drift lower toward **159.170**. A break below that support could expose deeper downside toward the **158.80 demand zone**.
Following the breakdown, price entered a consolidation phase around the Ichimoku Cloud. Recent candles show repeated rejection near the 159.45–159.50 resistance area, while failing to establish new highs. This suggests sellers are beginning to gain control in the short term.
The highlighted blue horizontal level at 159.170 represents a key support zone and the projected downside target. The bearish scenario anticipates a continuation of the pullback from current levels toward this support area.
**Target:** 🎯 **159.170**
* Current Price: **159.451**
* Downside Target: **159.170**
* Potential Move: Approximately **28 pips**
* Immediate Resistance: **159.45–159.50**
* Key Support: **159.170**
* Additional Support Zone: **158.80–158.85** (green demand area)
* Bearish Bias Valid Below: **159.50**
* Invalidation: A sustained breakout above **159.50–159.60** would weaken the bearish outlook and could signal a resumption of the broader uptrend.
**Trade Idea:**
The chart suggests a short-term bearish correction within a larger bullish trend. As long as USD/JPY remains below the recent resistance zone and struggles to reclaim the broken ascending channel, price may drift lower toward **159.170**. A break below that support could expose deeper downside toward the **158.80 demand zone**.
액티브 트레이드
Active 
join this channel for free signals
t.me/+EM2OGkUHG5g5MjA0
join this for trading education purpose
t.me/+EM2OGkUHG5g5MjA0
t.me/+EM2OGkUHG5g5MjA0
join this for trading education purpose
t.me/+EM2OGkUHG5g5MjA0
관련 발행물
면책사항
해당 정보와 게시물은 금융, 투자, 트레이딩 또는 기타 유형의 조언이나 권장 사항으로 간주되지 않으며, 트레이딩뷰에서 제공하거나 보증하는 것이 아닙니다. 자세한 내용은 이용 약관을 참조하세요.
join this channel for free signals
t.me/+EM2OGkUHG5g5MjA0
join this for trading education purpose
t.me/+EM2OGkUHG5g5MjA0
t.me/+EM2OGkUHG5g5MjA0
join this for trading education purpose
t.me/+EM2OGkUHG5g5MjA0
관련 발행물
면책사항
해당 정보와 게시물은 금융, 투자, 트레이딩 또는 기타 유형의 조언이나 권장 사항으로 간주되지 않으며, 트레이딩뷰에서 제공하거나 보증하는 것이 아닙니다. 자세한 내용은 이용 약관을 참조하세요.