

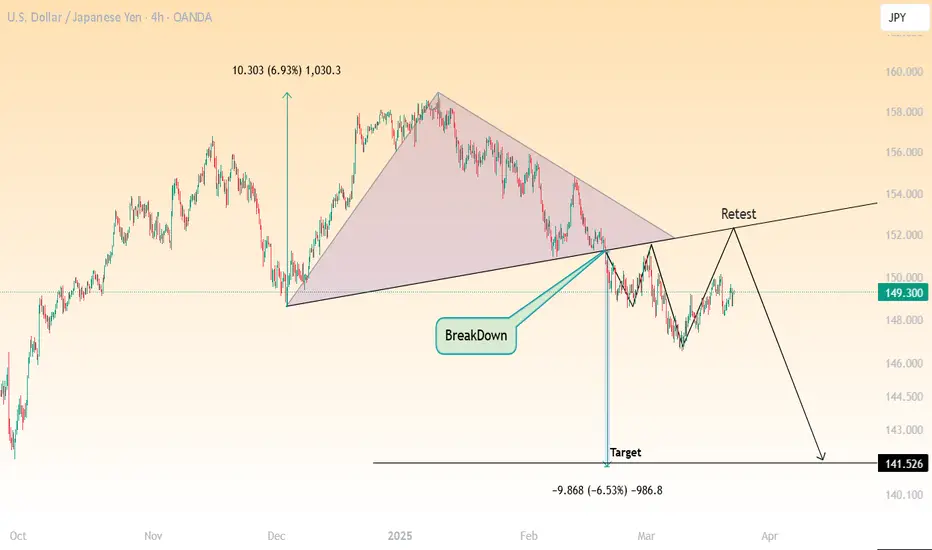
USDJPY has recently broken down from a large symmetrical triangle pattern visible on the 4H timeframe. After a prolonged uptrend that formed the triangle structure, price decisively broke below the lower support line, indicating a shift in momentum from bullish to bearish.
📊 Technical Breakdown
1. Symmetrical Triangle Breakdown
Price formed a classic symmetrical triangle pattern over several months.
A strong bearish breakout occurred from the lower trendline, signaling a potential reversal.
The projected measured move target from this breakdown points toward 141.526, representing a 6.5% decline.
2. Retest Zone
Price has pulled back to retest the broken triangle trendline from below.
This bearish retest setup is a textbook confirmation of resistance turning from previous support.
The current consolidation suggests the market is gathering liquidity before a potential next leg down.
3. Market Structure & Momentum
Lower highs and lower lows are now forming post-breakdown, confirming a bearish structure.
A clear rejection from the retest zone around the 151.500–152.000 level would further validate the short thesis.
🧠 Trade Idea
Entry Zone: On confirmation of rejection near the retest (~151.5 area)
Target: 141.526 (Measured move from triangle breakdown)
Stop Loss: Above the triangle high or above the recent swing (~153.00+)
Risk-Reward: High probability play based on pattern + structure shift
⚠️ Key Watch Levels
Resistance: 151.5–152.0 (triangle retest)
Support/Target: 141.5 (measured move)
Break above 153.0 will invalidate this bearish bias.
📊 Technical Breakdown
1. Symmetrical Triangle Breakdown
Price formed a classic symmetrical triangle pattern over several months.
A strong bearish breakout occurred from the lower trendline, signaling a potential reversal.
The projected measured move target from this breakdown points toward 141.526, representing a 6.5% decline.
2. Retest Zone
Price has pulled back to retest the broken triangle trendline from below.
This bearish retest setup is a textbook confirmation of resistance turning from previous support.
The current consolidation suggests the market is gathering liquidity before a potential next leg down.
3. Market Structure & Momentum
Lower highs and lower lows are now forming post-breakdown, confirming a bearish structure.
A clear rejection from the retest zone around the 151.500–152.000 level would further validate the short thesis.
🧠 Trade Idea
Entry Zone: On confirmation of rejection near the retest (~151.5 area)
Target: 141.526 (Measured move from triangle breakdown)
Stop Loss: Above the triangle high or above the recent swing (~153.00+)
Risk-Reward: High probability play based on pattern + structure shift
⚠️ Key Watch Levels
Resistance: 151.5–152.0 (triangle retest)
Support/Target: 141.5 (measured move)
Break above 153.0 will invalidate this bearish bias.

관련 발행물
면책사항
해당 정보와 게시물은 금융, 투자, 트레이딩 또는 기타 유형의 조언이나 권장 사항으로 간주되지 않으며, 트레이딩뷰에서 제공하거나 보증하는 것이 아닙니다. 자세한 내용은 이용 약관을 참조하세요.
면책사항
해당 정보와 게시물은 금융, 투자, 트레이딩 또는 기타 유형의 조언이나 권장 사항으로 간주되지 않으며, 트레이딩뷰에서 제공하거나 보증하는 것이 아닙니다. 자세한 내용은 이용 약관을 참조하세요.