

Happy new week traders!
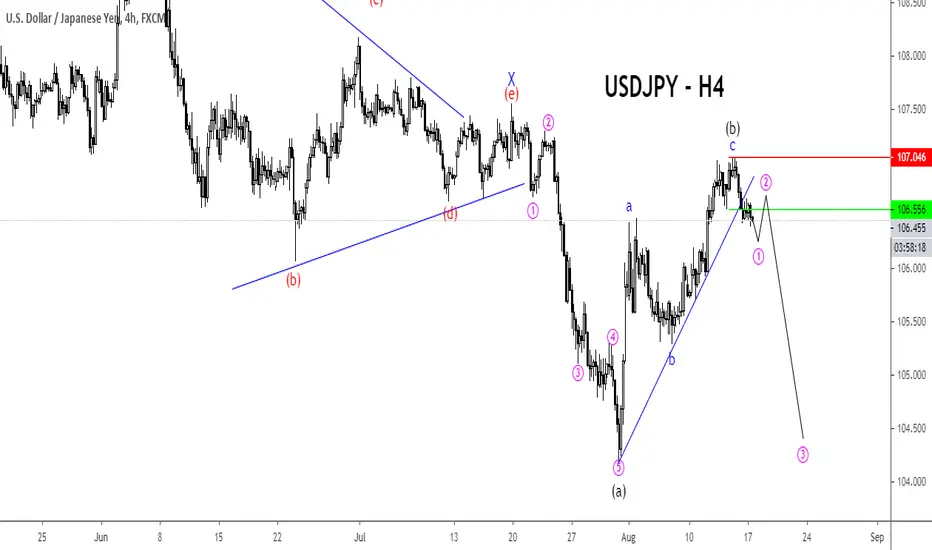
In the USDJPY 4 hourly chart above, price broke out of a triangle pattern and made a five-wave impulse decline in wave (a).
A three-wave corrective move that unfolded has a zigzag pattern follows the sell-off in wave (b).
According to Elliot Wave theory, once a 5-3 wave cycle is completed, the price resumes in the direction of the impulse wave.
In USDJPY case, if this count is correct we should see a massive decline that will take the low of wave (a) in the days ahead.
- Invalidation level is the red line on the chart
- Entry is the green line which has been triggered
Alternative Count: 1-2, (I)-(ii).
Good luck on the chart!
Veejahbee
In the USDJPY 4 hourly chart above, price broke out of a triangle pattern and made a five-wave impulse decline in wave (a).
A three-wave corrective move that unfolded has a zigzag pattern follows the sell-off in wave (b).
According to Elliot Wave theory, once a 5-3 wave cycle is completed, the price resumes in the direction of the impulse wave.
In USDJPY case, if this count is correct we should see a massive decline that will take the low of wave (a) in the days ahead.
- Invalidation level is the red line on the chart
- Entry is the green line which has been triggered
Alternative Count: 1-2, (I)-(ii).
Good luck on the chart!
Veejahbee

면책사항
해당 정보와 게시물은 금융, 투자, 트레이딩 또는 기타 유형의 조언이나 권장 사항으로 간주되지 않으며, 트레이딩뷰에서 제공하거나 보증하는 것이 아닙니다. 자세한 내용은 이용 약관을 참조하세요.
면책사항
해당 정보와 게시물은 금융, 투자, 트레이딩 또는 기타 유형의 조언이나 권장 사항으로 간주되지 않으며, 트레이딩뷰에서 제공하거나 보증하는 것이 아닙니다. 자세한 내용은 이용 약관을 참조하세요.