

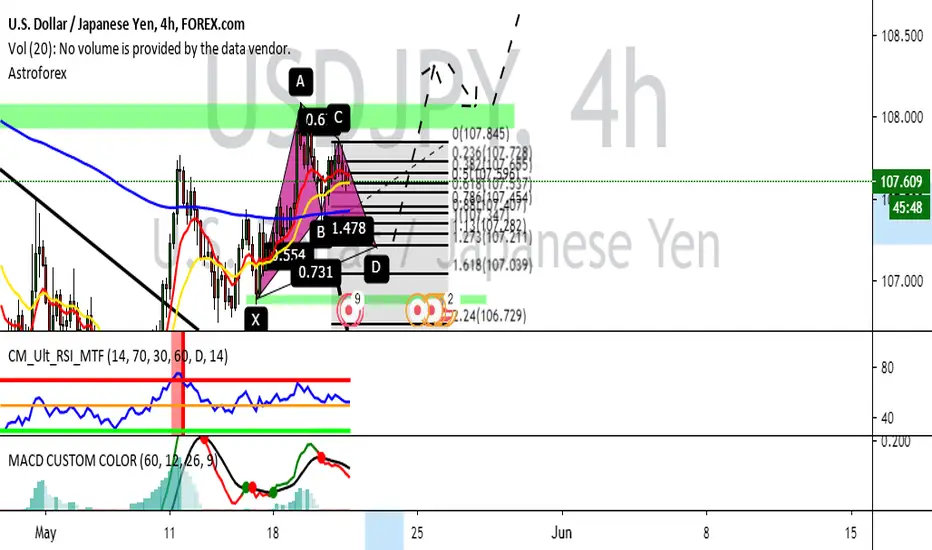
Guys, I don't trade trading this week because I make a following, but I complete my weekly to earning 15% in my DEMO account, but this is my scenario possible what USD/JPY can be. Now indicators like RSI and MACD are in the higher zone, and a possible drop of the price it's can to find down the -0.273% of Fibonacci or -0.618% of Fibonacci to complete the bullish Gartley armonic pattern. And also, and a sell it to find up 38 pips it's a great to take a consideration, and the range of 50 pips if you want to entry in a sell it. So, for me it's short position what the price do. And later going to put a buy order, but with confirmation of price action and indicators what use it.

면책사항
해당 정보와 게시물은 금융, 투자, 트레이딩 또는 기타 유형의 조언이나 권장 사항으로 간주되지 않으며, 트레이딩뷰에서 제공하거나 보증하는 것이 아닙니다. 자세한 내용은 이용 약관을 참조하세요.
면책사항
해당 정보와 게시물은 금융, 투자, 트레이딩 또는 기타 유형의 조언이나 권장 사항으로 간주되지 않으며, 트레이딩뷰에서 제공하거나 보증하는 것이 아닙니다. 자세한 내용은 이용 약관을 참조하세요.