

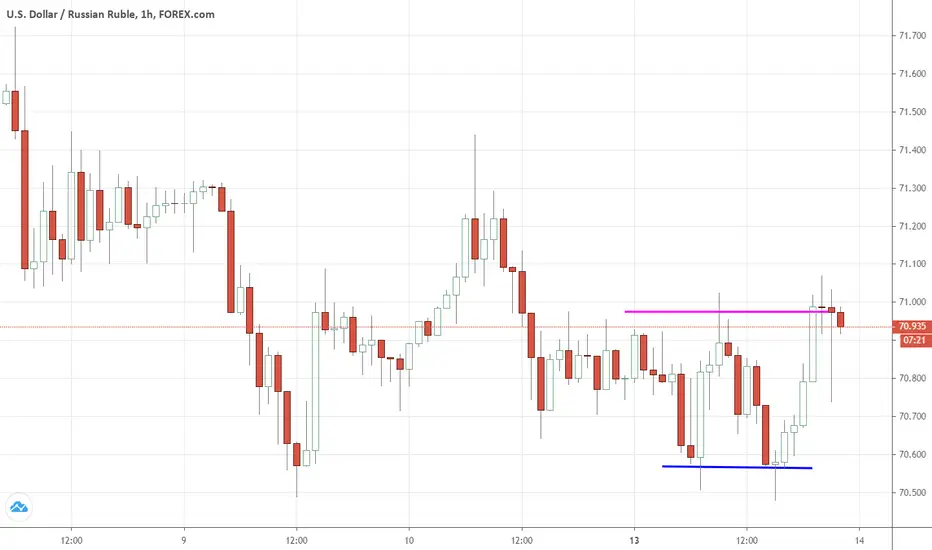
STATUS - Confirmed
CURRENT CONFIDENCE = 61%
TARGET (EXIT) PRICE = 71.170617 RUB
BREAKOUT (ENTRY) PRICE = 70.855133 RUB
DISTANCE TO TARGET PRICE = 0.56% (39.9 pips)
EMERGED ON Jul 13, 07:00 PM (UTC)
CONFIRMED ON Jul 13, 07:30 PM (UTC)
WITH CONFIDENCE LEVEL = 75%
Tickeron AI shows that the Rectangle Top pattern forms when the price of a pair is stuck in a range bound motion. Two horizontal lines (top: 1, 3, 5) and (bottom: 2, 4) form the pattern as the pair bounces up and down between support and resistance levels. Depending on who gives up first buyers or sellers the price can breakout in either direction.
This pattern is commonly associated with directionless markets. Usually the pattern performs better when there is a strong uptrend leading into the formation.
Trade idea
Tickeron AI shows that If the price breaks out from the top pattern boundary, day traders and swing traders should trade with an UP trend. Consider buying a pair or a call option at the breakout price level. To identify an exit, compute the target price level by adding the pattern height (which is the distance between the horizontal line (from top to bottom) and add it from the breakout price.
To limit potential loss when price suddenly goes in the wrong direction, consider placing a stop order to sell at or below the breakout price.
CURRENT CONFIDENCE = 61%
TARGET (EXIT) PRICE = 71.170617 RUB
BREAKOUT (ENTRY) PRICE = 70.855133 RUB
DISTANCE TO TARGET PRICE = 0.56% (39.9 pips)
EMERGED ON Jul 13, 07:00 PM (UTC)
CONFIRMED ON Jul 13, 07:30 PM (UTC)
WITH CONFIDENCE LEVEL = 75%
Tickeron AI shows that the Rectangle Top pattern forms when the price of a pair is stuck in a range bound motion. Two horizontal lines (top: 1, 3, 5) and (bottom: 2, 4) form the pattern as the pair bounces up and down between support and resistance levels. Depending on who gives up first buyers or sellers the price can breakout in either direction.
This pattern is commonly associated with directionless markets. Usually the pattern performs better when there is a strong uptrend leading into the formation.
Trade idea
Tickeron AI shows that If the price breaks out from the top pattern boundary, day traders and swing traders should trade with an UP trend. Consider buying a pair or a call option at the breakout price level. To identify an exit, compute the target price level by adding the pattern height (which is the distance between the horizontal line (from top to bottom) and add it from the breakout price.
To limit potential loss when price suddenly goes in the wrong direction, consider placing a stop order to sell at or below the breakout price.

면책사항
해당 정보와 게시물은 금융, 투자, 트레이딩 또는 기타 유형의 조언이나 권장 사항으로 간주되지 않으며, 트레이딩뷰에서 제공하거나 보증하는 것이 아닙니다. 자세한 내용은 이용 약관을 참조하세요.
면책사항
해당 정보와 게시물은 금융, 투자, 트레이딩 또는 기타 유형의 조언이나 권장 사항으로 간주되지 않으며, 트레이딩뷰에서 제공하거나 보증하는 것이 아닙니다. 자세한 내용은 이용 약관을 참조하세요.