
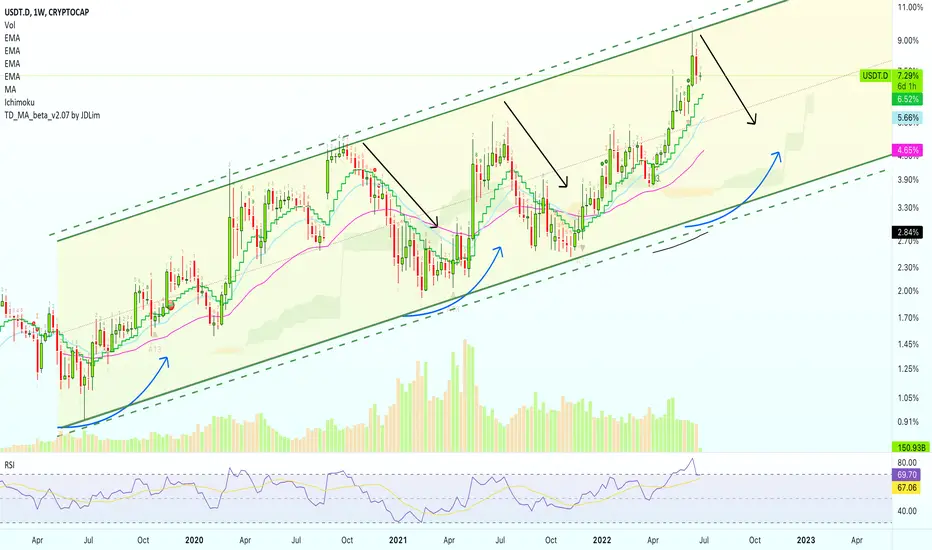
This is the long-term chart for Tether Dominance (USDT.D) and we are looking mainly at an ascending channel.
Each time the upper-band of the channel is hit we get a retrace/correction.
The upper-band being hit coincides with an overbought RSI.
An overbought RSI has always led to a strong correction.
Just yesterday/last week, USDT.D closed with the highest RSI value ever, signaling an overbought status.
It is only a matter of time before Bitcoin starts to grow; big, fast & strong.
I meant to say, it is only a matter of time before Tether Dominances drops.
Namaste.
Each time the upper-band of the channel is hit we get a retrace/correction.
The upper-band being hit coincides with an overbought RSI.
An overbought RSI has always led to a strong correction.
Just yesterday/last week, USDT.D closed with the highest RSI value ever, signaling an overbought status.
It is only a matter of time before Bitcoin starts to grow; big, fast & strong.
I meant to say, it is only a matter of time before Tether Dominances drops.
Namaste.

💯 Trading signals (results)
— Late 2026👇
t.me/masteranandatrades/9279
🔥 10-25X Leverage
—Trade-numbers:
t.me/masteranandatrades/9271
✅ PREMIUM &Content
—One-Time Payment
t.me/lamatrades/4 (🔝 since 2017)
— Late 2026👇
t.me/masteranandatrades/9279
🔥 10-25X Leverage
—Trade-numbers:
t.me/masteranandatrades/9271
✅ PREMIUM &Content
—One-Time Payment
t.me/lamatrades/4 (🔝 since 2017)
관련 발행물
면책사항
해당 정보와 게시물은 금융, 투자, 트레이딩 또는 기타 유형의 조언이나 권장 사항으로 간주되지 않으며, 트레이딩뷰에서 제공하거나 보증하는 것이 아닙니다. 자세한 내용은 이용 약관을 참조하세요.
💯 Trading signals (results)
— Late 2026👇
t.me/masteranandatrades/9279
🔥 10-25X Leverage
—Trade-numbers:
t.me/masteranandatrades/9271
✅ PREMIUM &Content
—One-Time Payment
t.me/lamatrades/4 (🔝 since 2017)
— Late 2026👇
t.me/masteranandatrades/9279
🔥 10-25X Leverage
—Trade-numbers:
t.me/masteranandatrades/9271
✅ PREMIUM &Content
—One-Time Payment
t.me/lamatrades/4 (🔝 since 2017)
관련 발행물
면책사항
해당 정보와 게시물은 금융, 투자, 트레이딩 또는 기타 유형의 조언이나 권장 사항으로 간주되지 않으며, 트레이딩뷰에서 제공하거나 보증하는 것이 아닙니다. 자세한 내용은 이용 약관을 참조하세요.