
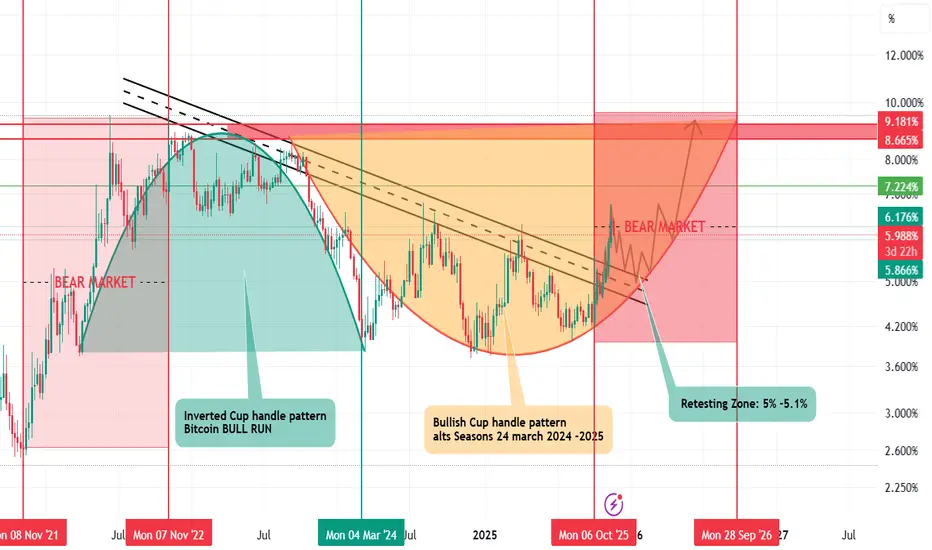
USDT.D Dominance: The Hidden Cycle Behind Crypto Bull & Bear Markets (2021–2026)
The USDT.D dominance chart offers a clear window into the underlying market sentiment: when stablecoin dominance rises, the market tends to weaken, and when it falls, risk-on assets thrive.
🔹 Market Implications:
💡 Pro Tip: Always combine dominance analysis with price action and volume for better timing in crypto markets.
The USDT.D dominance chart offers a clear window into the underlying market sentiment: when stablecoin dominance rises, the market tends to weaken, and when it falls, risk-on assets thrive.
🔹 Market Implications:
💡 Pro Tip: Always combine dominance analysis with price action and volume for better timing in crypto markets.

관련 발행물
면책사항
해당 정보와 게시물은 금융, 투자, 트레이딩 또는 기타 유형의 조언이나 권장 사항으로 간주되지 않으며, 트레이딩뷰에서 제공하거나 보증하는 것이 아닙니다. 자세한 내용은 이용 약관을 참조하세요.
관련 발행물
면책사항
해당 정보와 게시물은 금융, 투자, 트레이딩 또는 기타 유형의 조언이나 권장 사항으로 간주되지 않으며, 트레이딩뷰에서 제공하거나 보증하는 것이 아닙니다. 자세한 내용은 이용 약관을 참조하세요.