
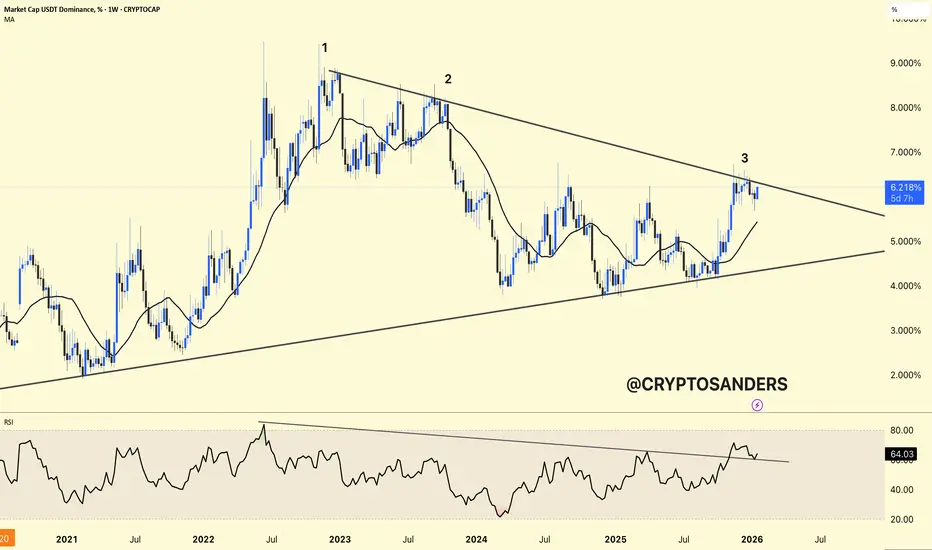
USDT dominance is still grinding inside the rising wedge pattern, with price forming a series of higher lows but showing signs of exhaustion near the upper boundary.
The multi‑year rising wedge has held as the dominant structure since 2022, with the latest bounce from the lower trendline now testing the 6.3–6.5% resistance zone where prior rejections have clustered.
RSI is in a bearish divergence on the weekly timeframe, which often flags the end of these dominance uptrends as capital starts rotating back into risk assets.
As long as dominance stays below 6.5% and holds the lower wedge line around 5.2–5.3%, the bias leans toward a breakdown that could signal stronger altcoin performance ahead.
A clean break below the wedge and 5.2% opens measured downside toward 4% or lower; upside risk to 6.8% remains if it pushes higher, but the pattern suggests reversal is more likely here.
The multi‑year rising wedge has held as the dominant structure since 2022, with the latest bounce from the lower trendline now testing the 6.3–6.5% resistance zone where prior rejections have clustered.
RSI is in a bearish divergence on the weekly timeframe, which often flags the end of these dominance uptrends as capital starts rotating back into risk assets.
As long as dominance stays below 6.5% and holds the lower wedge line around 5.2–5.3%, the bias leans toward a breakdown that could signal stronger altcoin performance ahead.
A clean break below the wedge and 5.2% opens measured downside toward 4% or lower; upside risk to 6.8% remains if it pushes higher, but the pattern suggests reversal is more likely here.

관련 발행물
면책사항
해당 정보와 게시물은 금융, 투자, 트레이딩 또는 기타 유형의 조언이나 권장 사항으로 간주되지 않으며, 트레이딩뷰에서 제공하거나 보증하는 것이 아닙니다. 자세한 내용은 이용 약관을 참조하세요.
관련 발행물
면책사항
해당 정보와 게시물은 금융, 투자, 트레이딩 또는 기타 유형의 조언이나 권장 사항으로 간주되지 않으며, 트레이딩뷰에서 제공하거나 보증하는 것이 아닙니다. 자세한 내용은 이용 약관을 참조하세요.