
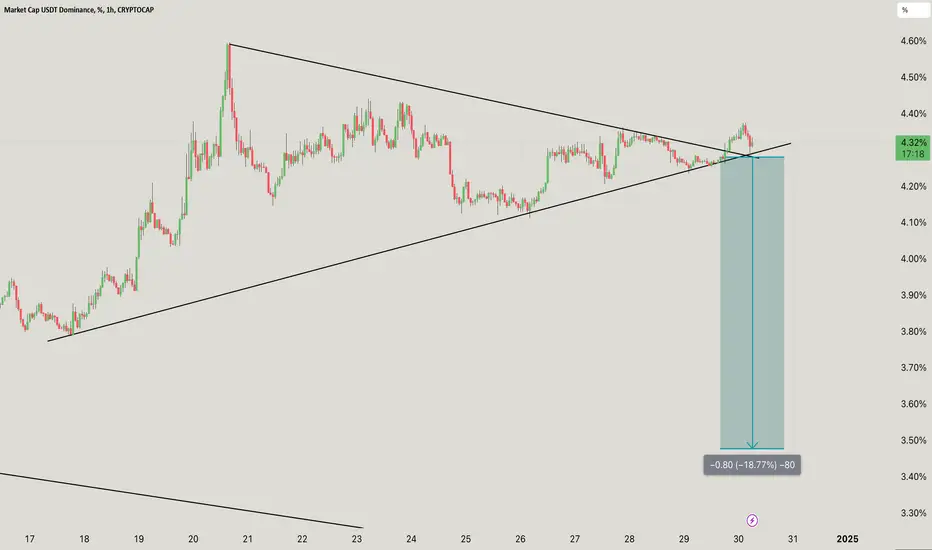
The chart shows a symmetrical triangle formation, indicating a potential breakout scenario.
A break to the downside could lead to a significant decrease in USDT dominance, as the chart’s measured move suggests.
A breakdown from current levels could result in a drop to 18.77%, aiming to move towards 3.50% dominance.
Breakdown Scenario:
If the dominance breaks below 4.30%, expect a drop towards 3.50%.
This could be in line with a bullish scenario for the altcoin, as a decrease in USDT dominance often signals capital inflows into crypto assets.
A move above 4.40% would invalidate the bearish setup and could signal further consolidation or an upside breakout.
A drop in USDT dominance often correlates with altcoin rallies, as traders allocate capital to riskier assets.
Wait for a confirmed breakout or breakdown with adequate volume before entering any position.
Disclaimer:
Chart patterns provide probabilities, not guarantees. Do additional research and ensure proper risk management before taking action.
Let me know if you’d like further assistance or adjustments!
DYOR. NFA
A break to the downside could lead to a significant decrease in USDT dominance, as the chart’s measured move suggests.
A breakdown from current levels could result in a drop to 18.77%, aiming to move towards 3.50% dominance.
Breakdown Scenario:
If the dominance breaks below 4.30%, expect a drop towards 3.50%.
This could be in line with a bullish scenario for the altcoin, as a decrease in USDT dominance often signals capital inflows into crypto assets.
A move above 4.40% would invalidate the bearish setup and could signal further consolidation or an upside breakout.
A drop in USDT dominance often correlates with altcoin rallies, as traders allocate capital to riskier assets.
Wait for a confirmed breakout or breakdown with adequate volume before entering any position.
Disclaimer:
Chart patterns provide probabilities, not guarantees. Do additional research and ensure proper risk management before taking action.
Let me know if you’d like further assistance or adjustments!
DYOR. NFA

관련 발행물
면책사항
해당 정보와 게시물은 금융, 투자, 트레이딩 또는 기타 유형의 조언이나 권장 사항으로 간주되지 않으며, 트레이딩뷰에서 제공하거나 보증하는 것이 아닙니다. 자세한 내용은 이용 약관을 참조하세요.
관련 발행물
면책사항
해당 정보와 게시물은 금융, 투자, 트레이딩 또는 기타 유형의 조언이나 권장 사항으로 간주되지 않으며, 트레이딩뷰에서 제공하거나 보증하는 것이 아닙니다. 자세한 내용은 이용 약관을 참조하세요.