
Second Point:
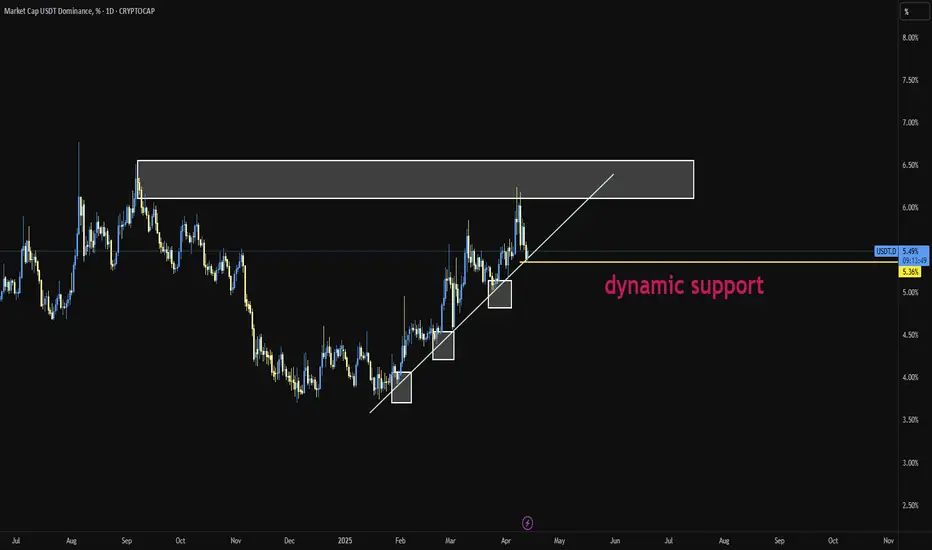
The USDT Dominance on the daily timeframe is showing the exact opposite behavior of Bitcoin. It has reached a supportive trendline which, for the past 3 months, has led to a reversal every time the index has touched it — pushing the market one level lower. And now, we're back at that critical zone again.
Will things be different this time?
This current touch appears to be a wave F, and perhaps we could even consider a potential wave G, which would imply one final leg up for USDT Dominance. However, there’s no certainty. There’s also the possibility that the trendline breaks, tether gets deployed, and the market becomes just a little — just a little — more pleasant.
We're literally on the edge right now, and this is where market pumps and dumps tend to occur — right in these key zones.
When will the situation become clear?
We have an important time zone coming up, and it’s likely that within the next couple of days, market makers will show their hand.
What do you think will happen?
Trendline breaks → Market pump
Trendline holds → Market dump ❤️

"🤖 Smart Trading Bots | 🚀 Advanced Market Analysis & Strategies | Helping You Trade Smarter, Not Harder!" ترید بات نبضار nabzar
면책사항
해당 정보와 게시물은 금융, 투자, 트레이딩 또는 기타 유형의 조언이나 권장 사항으로 간주되지 않으며, 트레이딩뷰에서 제공하거나 보증하는 것이 아닙니다. 자세한 내용은 이용 약관을 참조하세요.
"🤖 Smart Trading Bots | 🚀 Advanced Market Analysis & Strategies | Helping You Trade Smarter, Not Harder!" ترید بات نبضار nabzar
면책사항
해당 정보와 게시물은 금융, 투자, 트레이딩 또는 기타 유형의 조언이나 권장 사항으로 간주되지 않으며, 트레이딩뷰에서 제공하거나 보증하는 것이 아닙니다. 자세한 내용은 이용 약관을 참조하세요.