
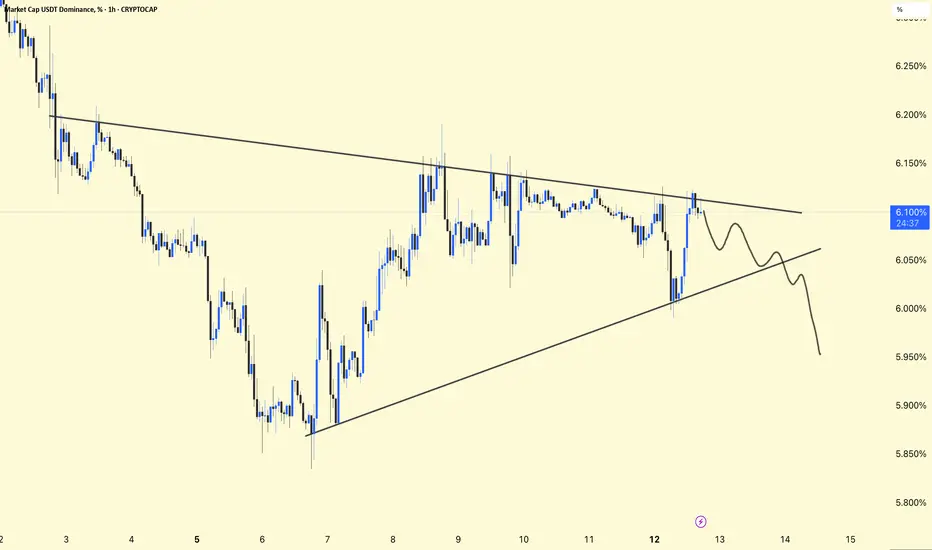
USDT Dominance (1H) – Chart Update
USDT.D is trading inside a symmetrical triangle, formed by a descending resistance and rising support — indicating market indecision.
Price is hovering near the upper half of the pattern, facing rejection from the descending trendline around 6.10–6.15%.
Likely move toward the rising support, which would favor risk-on sentiment and support altcoins.
Signals risk-off, increasing chances of market pullback.
Confirms capital rotation into crypto, bullish for BTC & alts.
USDT.D is at a decision point. A confirmed breakout or breakdown will define the next short-term direction for the broader crypto market. Risk management is key until clarity emerges.
USDT.D is trading inside a symmetrical triangle, formed by a descending resistance and rising support — indicating market indecision.
Price is hovering near the upper half of the pattern, facing rejection from the descending trendline around 6.10–6.15%.
Likely move toward the rising support, which would favor risk-on sentiment and support altcoins.
Signals risk-off, increasing chances of market pullback.
Confirms capital rotation into crypto, bullish for BTC & alts.
USDT.D is at a decision point. A confirmed breakout or breakdown will define the next short-term direction for the broader crypto market. Risk management is key until clarity emerges.
노트
액티브 트레이드

관련 발행물
면책사항
해당 정보와 게시물은 금융, 투자, 트레이딩 또는 기타 유형의 조언이나 권장 사항으로 간주되지 않으며, 트레이딩뷰에서 제공하거나 보증하는 것이 아닙니다. 자세한 내용은 이용 약관을 참조하세요.
관련 발행물
면책사항
해당 정보와 게시물은 금융, 투자, 트레이딩 또는 기타 유형의 조언이나 권장 사항으로 간주되지 않으며, 트레이딩뷰에서 제공하거나 보증하는 것이 아닙니다. 자세한 내용은 이용 약관을 참조하세요.