
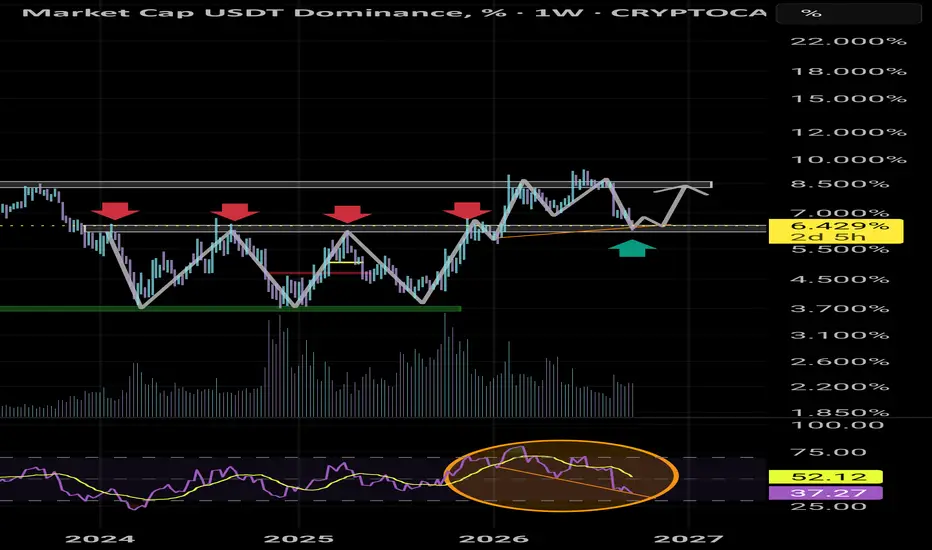
As we can see on the weekly chart we are pulling back to the area that counted as resistance 4 times as marked on the chart previously when USDT.D was below it.
Also weekly RSI is putting in lower lows and price is putting in higher lows which is a bullish divergence and we can't ignore it since the time frame is a Weekly chart. There is no way we'll be breaking a support which counted as resistance 4 times before.
My guess is that we'll have some consolidation or maybe a fake breakdown before shooting back up to the higher area marked on the chart. In my opinion a very big crash will happen soon.
Invalidation is if we break the current weekly support and close below it and only then the bull market will start and that's when I'll enter into BTC and ETH.
DYOR
Goodluck
Also weekly RSI is putting in lower lows and price is putting in higher lows which is a bullish divergence and we can't ignore it since the time frame is a Weekly chart. There is no way we'll be breaking a support which counted as resistance 4 times before.
My guess is that we'll have some consolidation or maybe a fake breakdown before shooting back up to the higher area marked on the chart. In my opinion a very big crash will happen soon.
Invalidation is if we break the current weekly support and close below it and only then the bull market will start and that's when I'll enter into BTC and ETH.
DYOR
Goodluck

면책사항
해당 정보와 게시물은 금융, 투자, 트레이딩 또는 기타 유형의 조언이나 권장 사항으로 간주되지 않으며, 트레이딩뷰에서 제공하거나 보증하는 것이 아닙니다. 자세한 내용은 이용 약관을 참조하세요.
면책사항
해당 정보와 게시물은 금융, 투자, 트레이딩 또는 기타 유형의 조언이나 권장 사항으로 간주되지 않으며, 트레이딩뷰에서 제공하거나 보증하는 것이 아닙니다. 자세한 내용은 이용 약관을 참조하세요.