

Unum flash note on the USDZAR from our Trading Desk analyst, Lester Davids.
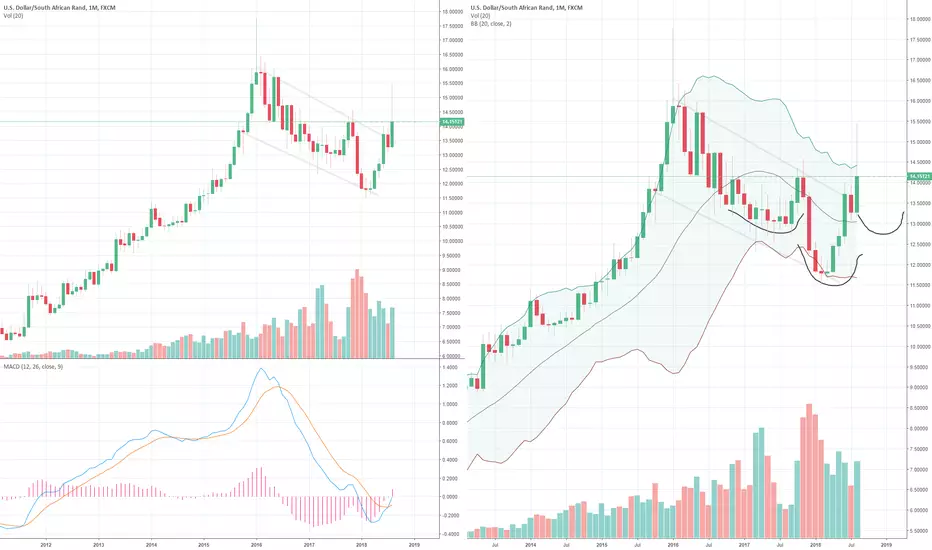
Chart 1: USDZAR: We currently trade just below the R14.25 resistance, with the Rand having gained on a weaker USD. The monthly chart shows this to be the top of the bull flag/channel.
Chart 2: Another view (again the monthly chart), shows the potential start of a "right shoulder" of a long term inverse H&S formation.
support and resistance levels from the bank analysts (Investec) this morning confirm these ranges (R1 14.2430, S1 14.15)
Chart 1: USDZAR: We currently trade just below the R14.25 resistance, with the Rand having gained on a weaker USD. The monthly chart shows this to be the top of the bull flag/channel.
Chart 2: Another view (again the monthly chart), shows the potential start of a "right shoulder" of a long term inverse H&S formation.
support and resistance levels from the bank analysts (Investec) this morning confirm these ranges (R1 14.2430, S1 14.15)

면책사항
해당 정보와 게시물은 금융, 투자, 트레이딩 또는 기타 유형의 조언이나 권장 사항으로 간주되지 않으며, 트레이딩뷰에서 제공하거나 보증하는 것이 아닙니다. 자세한 내용은 이용 약관을 참조하세요.
면책사항
해당 정보와 게시물은 금융, 투자, 트레이딩 또는 기타 유형의 조언이나 권장 사항으로 간주되지 않으며, 트레이딩뷰에서 제공하거나 보증하는 것이 아닙니다. 자세한 내용은 이용 약관을 참조하세요.