
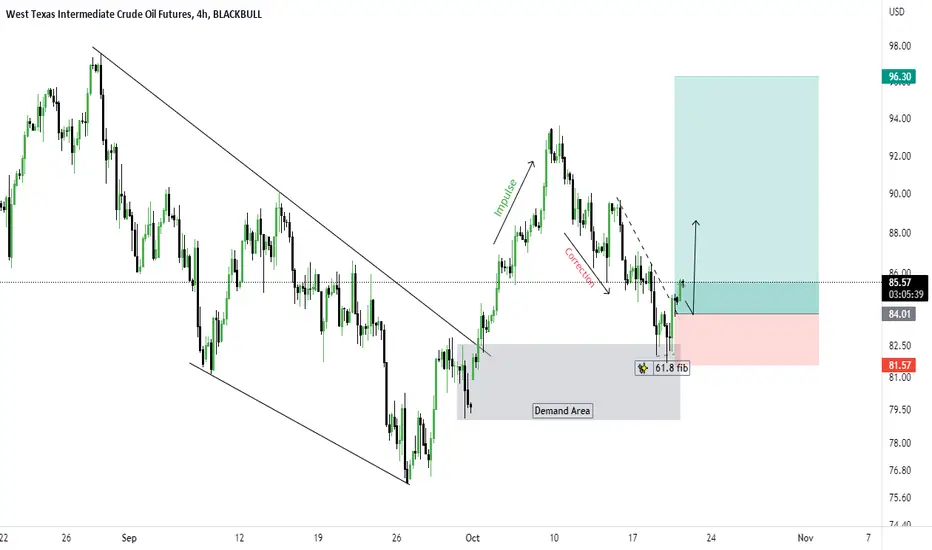
Hello Traders, here's a chart of the UsOil and right now i'm keeping a bullish bias.
Here are my reasons:
- Daily timeframe Break of structure
- H4 bullish impulse and correction into our demand zone
-Demand zone tallying with the 61.8 fib level
-Double bottom at demand zone/fib zone confluence.
I'm putting all these things together from a technical analysis POV. However, there's the fundamentals too and we see an increase in the price of gas cut across different countries since the Russian/Ukraine happenings. Could this be the fundamental backing that our technical thesis needs?
Anyways, don't take me as your single source of truth, and I hope this technical breakdown helps.
Do give us a LIKE and FOLLOW to support us in coming out with more contents.
Here are my reasons:
- Daily timeframe Break of structure
- H4 bullish impulse and correction into our demand zone
-Demand zone tallying with the 61.8 fib level
-Double bottom at demand zone/fib zone confluence.
I'm putting all these things together from a technical analysis POV. However, there's the fundamentals too and we see an increase in the price of gas cut across different countries since the Russian/Ukraine happenings. Could this be the fundamental backing that our technical thesis needs?
Anyways, don't take me as your single source of truth, and I hope this technical breakdown helps.
Do give us a LIKE and FOLLOW to support us in coming out with more contents.

면책사항
해당 정보와 게시물은 금융, 투자, 트레이딩 또는 기타 유형의 조언이나 권장 사항으로 간주되지 않으며, 트레이딩뷰에서 제공하거나 보증하는 것이 아닙니다. 자세한 내용은 이용 약관을 참조하세요.
면책사항
해당 정보와 게시물은 금융, 투자, 트레이딩 또는 기타 유형의 조언이나 권장 사항으로 간주되지 않으며, 트레이딩뷰에서 제공하거나 보증하는 것이 아닙니다. 자세한 내용은 이용 약관을 참조하세요.