
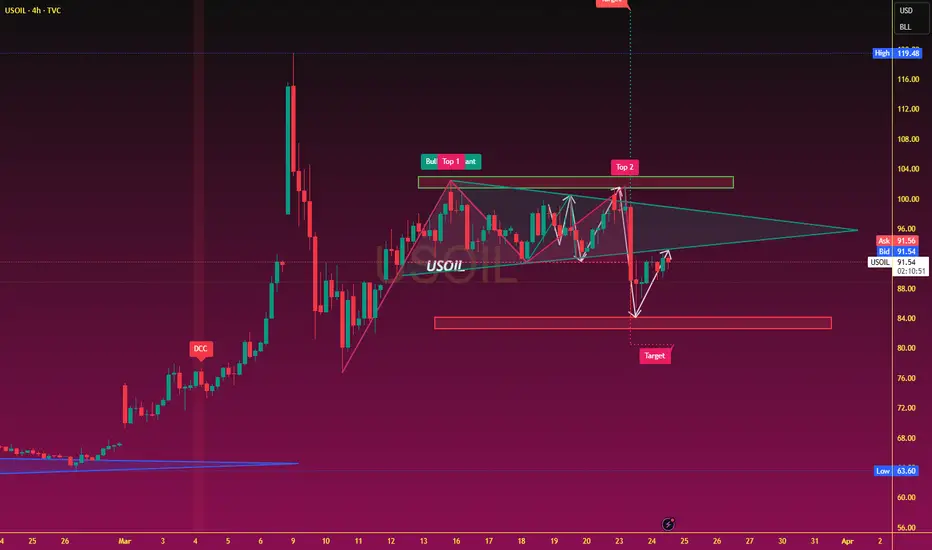
From a technical perspective, the daily chart structure indicates that—following a rapid surge to a peak—oil prices have formed a temporary top. Subsequently, driven by news-related shocks, the market witnessed a high-volume "long bearish candle," signaling a shift in the short-term trend from strength to weakness. The current key support level is situated near $85; a breach of this level could lead to a further decline toward the $80 region. Conversely, overhead resistance is concentrated around the $95 mark, acting as a significant cap on prices in the short term. In terms of momentum indicators, the daily-level RSI has retreated rapidly from overbought territory, suggesting a significant waning of bullish momentum. The current rebound appears to be primarily a technical correction, and the market is likely to continue its volatile, downward-biased trajectory. Furthermore, the MACD indicator is expanding below the zero line, further reinforcing the downside risks in the short term.

면책사항
해당 정보와 게시물은 금융, 투자, 트레이딩 또는 기타 유형의 조언이나 권장 사항으로 간주되지 않으며, 트레이딩뷰에서 제공하거나 보증하는 것이 아닙니다. 자세한 내용은 이용 약관을 참조하세요.
면책사항
해당 정보와 게시물은 금융, 투자, 트레이딩 또는 기타 유형의 조언이나 권장 사항으로 간주되지 않으며, 트레이딩뷰에서 제공하거나 보증하는 것이 아닙니다. 자세한 내용은 이용 약관을 참조하세요.