
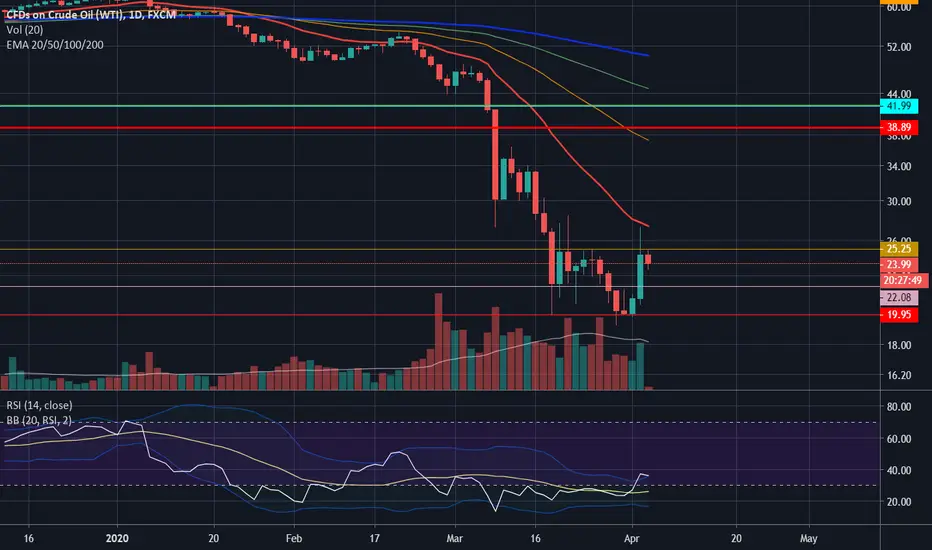
I'm monitoring crude oil price decline for several days now. I think that it is now ready for a counter trend rally. At least that is what my indicators are telling me.

Stochastic is turning up after a couple time in the lower region.

RSI forming a daily bullish divergence.

A very nice double bottom formation.
For now only lower highs and lower lows can be seen but if I intended to initiate a trade, I would wait for a higher lows to form and then manage risk accordingly.
22.08$ should provide good support.

for a take profit point, 41.99$ was where we were before everything went to shit.
As time goes by, I will keep you updated on the evolution of the price, so make sure to follow me on Tradingview
Disclaimer: This is not financial advice as I’m not a financial adviser.
This is just my knowledge on what can be said and done from the chart.
Due to the volatile nature of the market, everything can change on a day to day basis.
Everyone is wise to manage their risk properly when considering any trading decisions or activities.
Stochastic is turning up after a couple time in the lower region.
RSI forming a daily bullish divergence.
A very nice double bottom formation.
For now only lower highs and lower lows can be seen but if I intended to initiate a trade, I would wait for a higher lows to form and then manage risk accordingly.
22.08$ should provide good support.
for a take profit point, 41.99$ was where we were before everything went to shit.
As time goes by, I will keep you updated on the evolution of the price, so make sure to follow me on Tradingview
Disclaimer: This is not financial advice as I’m not a financial adviser.
This is just my knowledge on what can be said and done from the chart.
Due to the volatile nature of the market, everything can change on a day to day basis.
Everyone is wise to manage their risk properly when considering any trading decisions or activities.
노트
price is approaching buy territory.
노트
Price is making new lows but the RSI divergence is still at play meaning the real rally is yet to come.
매매 수동청산
it is very rare to see a falling wedge break downward but it can happen
that why we trade with stop loss.

관련 발행물
면책사항
해당 정보와 게시물은 금융, 투자, 트레이딩 또는 기타 유형의 조언이나 권장 사항으로 간주되지 않으며, 트레이딩뷰에서 제공하거나 보증하는 것이 아닙니다. 자세한 내용은 이용 약관을 참조하세요.
관련 발행물
면책사항
해당 정보와 게시물은 금융, 투자, 트레이딩 또는 기타 유형의 조언이나 권장 사항으로 간주되지 않으며, 트레이딩뷰에서 제공하거나 보증하는 것이 아닙니다. 자세한 내용은 이용 약관을 참조하세요.