
Hey traders, kindly support the idea push the like button, share and comment below.
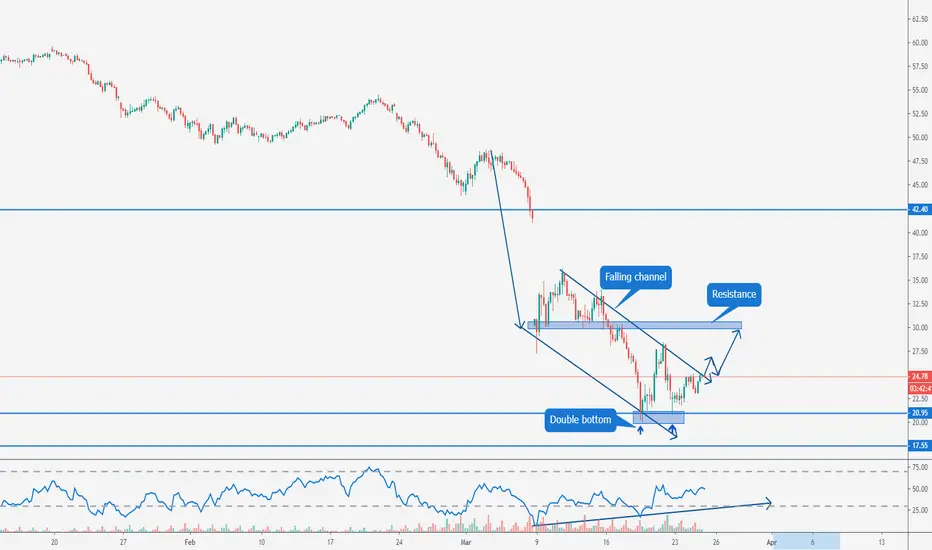
Here we can see prices formed falling channel with RSI divergence on Daily, 4-hours and 1-hour chart, also we can see potential double bottom, this could be signs that oil is stabilizing here and possibly going higher
If you like our idea and want to see more press the like button, share it, and do not forget to let us know your opinion below the post
Disclaimer: This information is not a recommendation to buy or sell. It is to be used for educational purposes only**
Here we can see prices formed falling channel with RSI divergence on Daily, 4-hours and 1-hour chart, also we can see potential double bottom, this could be signs that oil is stabilizing here and possibly going higher
If you like our idea and want to see more press the like button, share it, and do not forget to let us know your opinion below the post
Disclaimer: This information is not a recommendation to buy or sell. It is to be used for educational purposes only**

관련 발행물
면책사항
해당 정보와 게시물은 금융, 투자, 트레이딩 또는 기타 유형의 조언이나 권장 사항으로 간주되지 않으며, 트레이딩뷰에서 제공하거나 보증하는 것이 아닙니다. 자세한 내용은 이용 약관을 참조하세요.
관련 발행물
면책사항
해당 정보와 게시물은 금융, 투자, 트레이딩 또는 기타 유형의 조언이나 권장 사항으로 간주되지 않으며, 트레이딩뷰에서 제공하거나 보증하는 것이 아닙니다. 자세한 내용은 이용 약관을 참조하세요.