
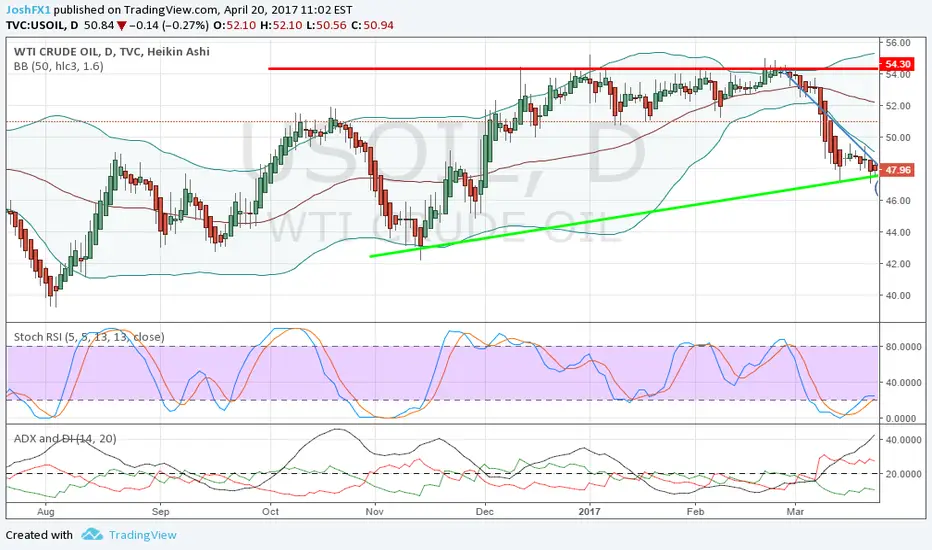
Crude Oil WTI daily time frame.
Looks to be in the process of a 3rd Elltiot
wave.
Stoch Rsi shows selling pressure and
DMI a strong bearish trend. Price also broke
through the 72 EMA. 3rd wave should beat
the low of wave 1. Meaning WTI might break 47.80.
Crude Oil WTI is a strong sell.
Looks to be in the process of a 3rd Elltiot
wave.
Stoch Rsi shows selling pressure and
DMI a strong bearish trend. Price also broke
through the 72 EMA. 3rd wave should beat
the low of wave 1. Meaning WTI might break 47.80.
Crude Oil WTI is a strong sell.
노트
Seems like TradingView moved the chart back to the right again when I published this idea. Because of this the Elliot Wave count isnt visible anymore.노트
I just booked my profit at 49.68 to relax and enjoy the weekend.If you wanna hold it till a possible 48 then place a stoploss at 50.20
to protect a part of your profit.
거래청산: 타겟 닿음

면책사항
해당 정보와 게시물은 금융, 투자, 트레이딩 또는 기타 유형의 조언이나 권장 사항으로 간주되지 않으며, 트레이딩뷰에서 제공하거나 보증하는 것이 아닙니다. 자세한 내용은 이용 약관을 참조하세요.
면책사항
해당 정보와 게시물은 금융, 투자, 트레이딩 또는 기타 유형의 조언이나 권장 사항으로 간주되지 않으며, 트레이딩뷰에서 제공하거나 보증하는 것이 아닙니다. 자세한 내용은 이용 약관을 참조하세요.