
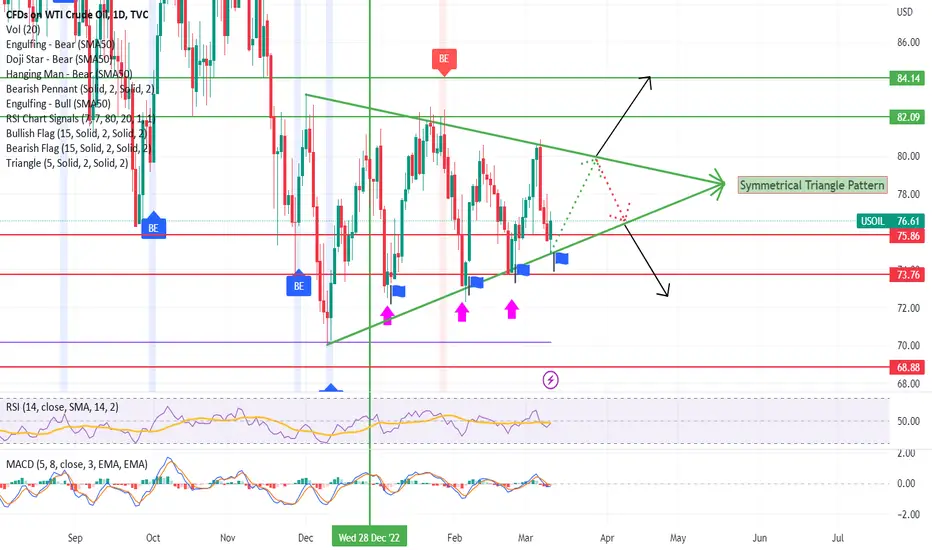
WTI Oil has formed a symmetrical triangle pattern on the price chart, which is a technical analysis pattern that appears when the highs and lows of the price action converge towards each other, forming a triangle shape. This pattern indicates a period of consolidation or indecision in the market, as buyers and sellers are evenly matched, causing the price to fluctuate within a tight range. Traders often watch for a confirmation of either a breakout or breakdown from this pattern, which can indicate a potential trend reversal or continuation. It's important to use additional indicators such as volume, momentum, and moving averages to confirm and evaluate the strength of the move before taking action. The crucial area to monitor is illustrated on the chart, and traders should be cautious of false breakouts.
Make necessary move during this breakout or breakdown.
Make necessary move during this breakout or breakdown.

면책사항
해당 정보와 게시물은 금융, 투자, 트레이딩 또는 기타 유형의 조언이나 권장 사항으로 간주되지 않으며, 트레이딩뷰에서 제공하거나 보증하는 것이 아닙니다. 자세한 내용은 이용 약관을 참조하세요.
면책사항
해당 정보와 게시물은 금융, 투자, 트레이딩 또는 기타 유형의 조언이나 권장 사항으로 간주되지 않으며, 트레이딩뷰에서 제공하거나 보증하는 것이 아닙니다. 자세한 내용은 이용 약관을 참조하세요.