
Monthly chart already Published
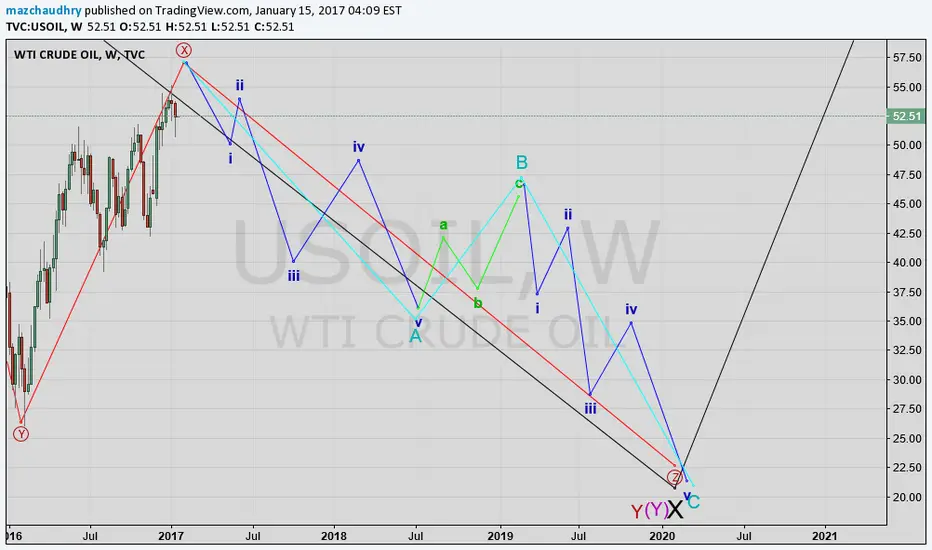
Here is my Weekly chart with Bit more explaining the short wave .
Short From 56.50 till 20.00 will be in ABC Formation ( As it is a Corrective Pattern )
Further division of ABC as bellow :
A= 12345
B= abc
C = 12345
Trade Plan ::
Lets wait for the Completion of X at 56.50
I will wait for (i)of A to complete
(ii) of A will be a Pullback there after a Congestion
I am going to enter into short trade at start of (iii)of A
many happy green pips to you all
Elliot Wave By mazchaudhry
Trade at your own Risk .

관련 발행물
면책사항
해당 정보와 게시물은 금융, 투자, 트레이딩 또는 기타 유형의 조언이나 권장 사항으로 간주되지 않으며, 트레이딩뷰에서 제공하거나 보증하는 것이 아닙니다. 자세한 내용은 이용 약관을 참조하세요.
면책사항
해당 정보와 게시물은 금융, 투자, 트레이딩 또는 기타 유형의 조언이나 권장 사항으로 간주되지 않으며, 트레이딩뷰에서 제공하거나 보증하는 것이 아닙니다. 자세한 내용은 이용 약관을 참조하세요.