
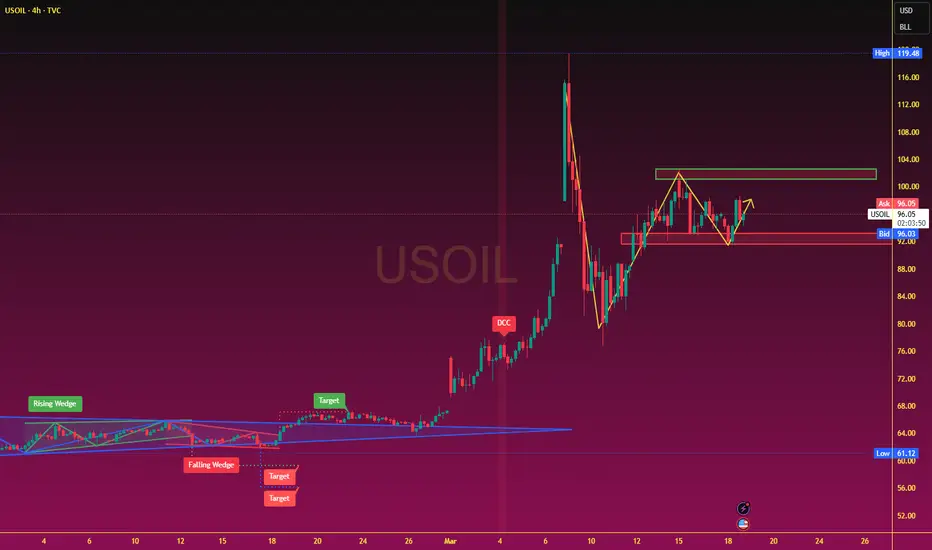
On the daily chart, oil prices surged above $110 due to geopolitical and macroeconomic influences. The moving average system is diverging upwards, indicating an upward trend in the medium term. The price action is currently in a secondary consolidation at higher levels, supported by the price action, but bullish momentum remains strong. The medium-term trend is expected to remain bullish. In the short term, crude oil is repeatedly crossing the moving average system, indicating a mainly volatile short-term trend. The range is expected to be between $105.60 and $91.00. The MACD indicator has broken upwards near the zero line, suggesting potential for further upward movement.
Trading Analysis: Crude oil broke through the resistance level around $96.3, which is expected to form new support. Today, the strategy is to prioritize buying on pullbacks, with selling on rallies as a secondary approach. Key resistance levels to watch are $101.5-$102.5, and key support levels are $97.5-$96.0.
Trading Summary: The key to success lies in consistently focusing on these detailed and accurate trading signals or real-time information. Traders who consistently follow these signals will ultimately succeed.

면책사항
해당 정보와 게시물은 금융, 투자, 트레이딩 또는 기타 유형의 조언이나 권장 사항으로 간주되지 않으며, 트레이딩뷰에서 제공하거나 보증하는 것이 아닙니다. 자세한 내용은 이용 약관을 참조하세요.
면책사항
해당 정보와 게시물은 금융, 투자, 트레이딩 또는 기타 유형의 조언이나 권장 사항으로 간주되지 않으며, 트레이딩뷰에서 제공하거나 보증하는 것이 아닙니다. 자세한 내용은 이용 약관을 참조하세요.