
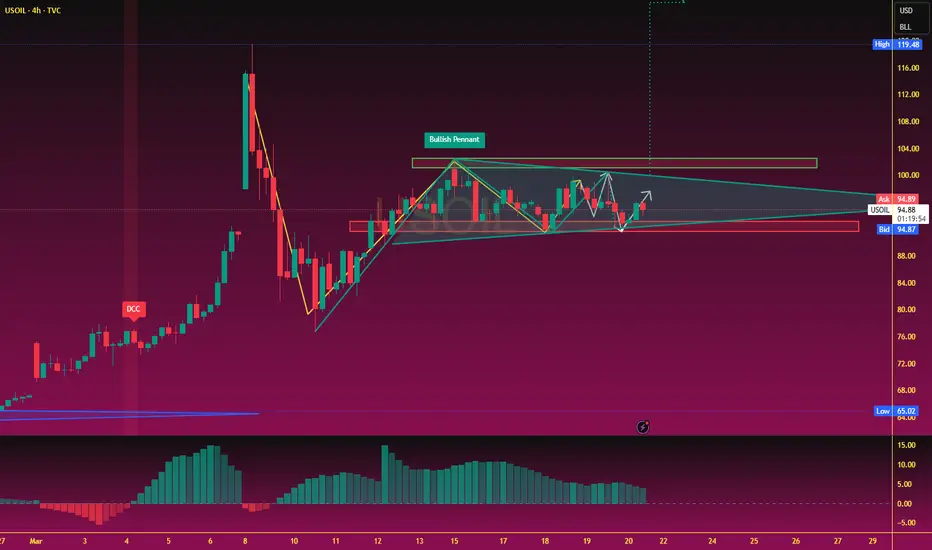
High-Level Fluctuations and Double-Top Pressure Amid Supply Disruption Concerns
Fundamentally, the Strait of Hormuz, a vital waterway for 20% of global oil and liquefied natural gas shipments, is facing a precarious security situation due to the escalating conflict between Iran and Israel. Attacks on Kuwaiti refineries have resulted in approximately 12% of the global demand gap remaining unfilled in the short term. Leading institutions have even warned that if the conflict continues, oil prices could break through $180 in late April.
Technically, Brent crude oil is currently in a short-term correction phase within a larger bullish trend. On the 4-hour chart, the price is currently trading near the Bollinger Band middle line at 107.05, which shows strong support. However, the MACD indicator shows the DIFF line crossing below the DEA line with continued green bars, suggesting a short-term need for correction. In terms of candlestick patterns, the high of 119.45 in early March and the recent high of 119.11 have begun to form a double-top pattern, making the upward pressure extremely heavy.
In the next 2-3 trading days, the key level to watch is the 107.05 middle Bollinger Band. If it holds, the price may retest the 114.95 upper Bollinger Band; if it breaks below, the next support level will be the lower Bollinger Band at 99.16. Amidst the interplay of anticipated extreme supply disruptions and technical adjustment pressures, crude oil prices are expected to remain highly volatile.
Fundamentally, the Strait of Hormuz, a vital waterway for 20% of global oil and liquefied natural gas shipments, is facing a precarious security situation due to the escalating conflict between Iran and Israel. Attacks on Kuwaiti refineries have resulted in approximately 12% of the global demand gap remaining unfilled in the short term. Leading institutions have even warned that if the conflict continues, oil prices could break through $180 in late April.
Technically, Brent crude oil is currently in a short-term correction phase within a larger bullish trend. On the 4-hour chart, the price is currently trading near the Bollinger Band middle line at 107.05, which shows strong support. However, the MACD indicator shows the DIFF line crossing below the DEA line with continued green bars, suggesting a short-term need for correction. In terms of candlestick patterns, the high of 119.45 in early March and the recent high of 119.11 have begun to form a double-top pattern, making the upward pressure extremely heavy.
In the next 2-3 trading days, the key level to watch is the 107.05 middle Bollinger Band. If it holds, the price may retest the 114.95 upper Bollinger Band; if it breaks below, the next support level will be the lower Bollinger Band at 99.16. Amidst the interplay of anticipated extreme supply disruptions and technical adjustment pressures, crude oil prices are expected to remain highly volatile.

면책사항
해당 정보와 게시물은 금융, 투자, 트레이딩 또는 기타 유형의 조언이나 권장 사항으로 간주되지 않으며, 트레이딩뷰에서 제공하거나 보증하는 것이 아닙니다. 자세한 내용은 이용 약관을 참조하세요.
면책사항
해당 정보와 게시물은 금융, 투자, 트레이딩 또는 기타 유형의 조언이나 권장 사항으로 간주되지 않으며, 트레이딩뷰에서 제공하거나 보증하는 것이 아닙니다. 자세한 내용은 이용 약관을 참조하세요.