
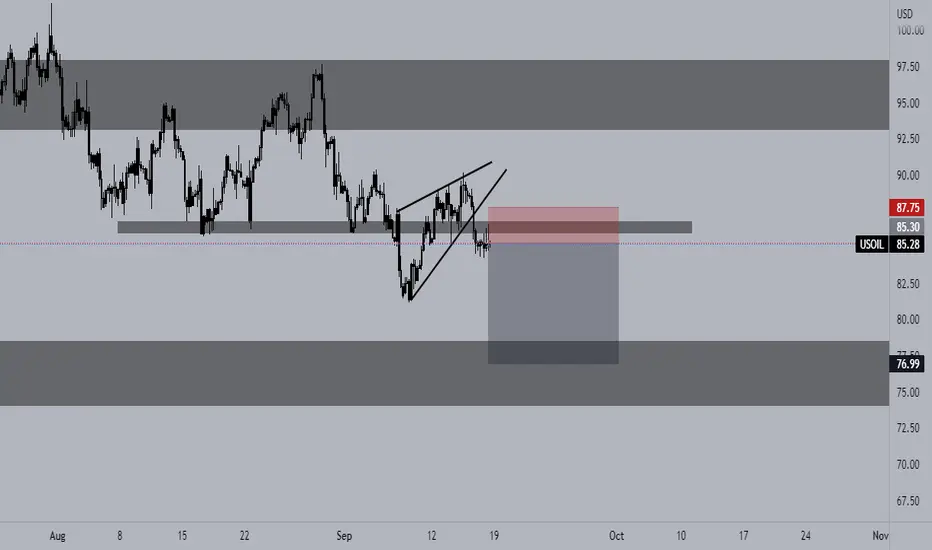
From the W1 timeframe, we can see a double top pattern that successfully broken the neckline confirming bearish pressure. Also, last weeks WI candle closed bearish confirming sell momentum.
On the D1, we can clearly see that price pulled back after what looked like a head and shoulders pattern and after failing to break the neckline slumped back below support. This also indicates strong bearish momentum.
Finally on my entry timeframe the H4, we see the ascending wedge which broke and came back to support to resistance before heading lower.

면책사항
해당 정보와 게시물은 금융, 투자, 트레이딩 또는 기타 유형의 조언이나 권장 사항으로 간주되지 않으며, 트레이딩뷰에서 제공하거나 보증하는 것이 아닙니다. 자세한 내용은 이용 약관을 참조하세요.
면책사항
해당 정보와 게시물은 금융, 투자, 트레이딩 또는 기타 유형의 조언이나 권장 사항으로 간주되지 않으며, 트레이딩뷰에서 제공하거나 보증하는 것이 아닙니다. 자세한 내용은 이용 약관을 참조하세요.